Immigrants from North Macedonia vs Belgian 6th Grade
COMPARE
Immigrants from North Macedonia
Belgian
6th Grade
6th Grade Comparison
Immigrants from North Macedonia
Belgians
97.2%
6TH GRADE
85.5/ 100
METRIC RATING
140th/ 347
METRIC RANK
97.9%
6TH GRADE
100.0/ 100
METRIC RATING
38th/ 347
METRIC RANK
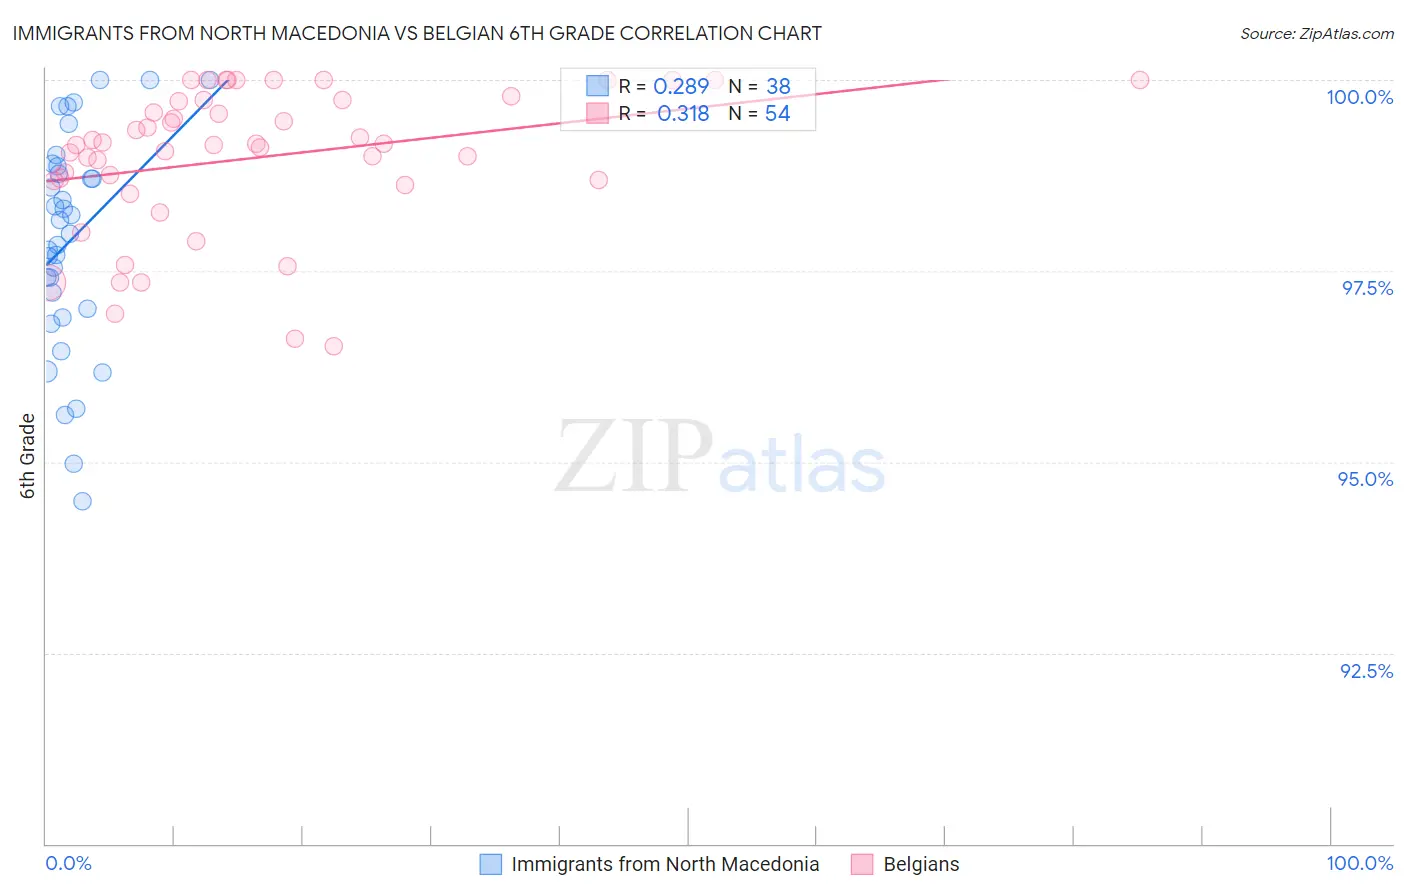
Immigrants from North Macedonia vs Belgian 6th Grade Correlation Chart
The statistical analysis conducted on geographies consisting of 74,317,186 people shows a weak positive correlation between the proportion of Immigrants from North Macedonia and percentage of population with at least 6th grade education in the United States with a correlation coefficient (R) of 0.289 and weighted average of 97.2%. Similarly, the statistical analysis conducted on geographies consisting of 356,016,627 people shows a mild positive correlation between the proportion of Belgians and percentage of population with at least 6th grade education in the United States with a correlation coefficient (R) of 0.318 and weighted average of 97.9%, a difference of 0.67%.
6th Grade Correlation Summary
| Measurement | Immigrants from North Macedonia | Belgian |
| Minimum | 94.5% | 96.5% |
| Maximum | 100.0% | 100.0% |
| Range | 5.5% | 3.5% |
| Mean | 97.9% | 99.0% |
| Median | 98.1% | 99.2% |
| Interquartile 25% (IQ1) | 97.0% | 98.7% |
| Interquartile 75% (IQ3) | 98.9% | 99.7% |
| Interquartile Range (IQR) | 1.9% | 1.1% |
| Standard Deviation (Sample) | 1.4% | 0.94% |
| Standard Deviation (Population) | 1.4% | 0.93% |
Similar Demographics by 6th Grade
Demographics Similar to Immigrants from North Macedonia by 6th Grade
In terms of 6th grade, the demographic groups most similar to Immigrants from North Macedonia are Immigrants from Turkey (97.3%, a difference of 0.010%), Seminole (97.2%, a difference of 0.010%), Jordanian (97.2%, a difference of 0.010%), Burmese (97.3%, a difference of 0.020%), and Blackfeet (97.3%, a difference of 0.020%).
| Demographics | Rating | Rank | 6th Grade |
| Immigrants | Moldova | 90.0 /100 | #133 | Excellent 97.3% |
| Immigrants | Kuwait | 89.5 /100 | #134 | Excellent 97.3% |
| Immigrants | Hungary | 89.5 /100 | #135 | Excellent 97.3% |
| Filipinos | 88.9 /100 | #136 | Excellent 97.3% |
| Burmese | 87.8 /100 | #137 | Excellent 97.3% |
| Blackfeet | 87.7 /100 | #138 | Excellent 97.3% |
| Immigrants | Turkey | 86.1 /100 | #139 | Excellent 97.3% |
| Immigrants | North Macedonia | 85.5 /100 | #140 | Excellent 97.2% |
| Seminole | 84.8 /100 | #141 | Excellent 97.2% |
| Jordanians | 84.6 /100 | #142 | Excellent 97.2% |
| Pima | 82.9 /100 | #143 | Excellent 97.2% |
| Israelis | 82.9 /100 | #144 | Excellent 97.2% |
| Spaniards | 80.1 /100 | #145 | Excellent 97.2% |
| Hopi | 78.8 /100 | #146 | Good 97.2% |
| Immigrants | South Central Asia | 78.1 /100 | #147 | Good 97.2% |
Demographics Similar to Belgians by 6th Grade
In terms of 6th grade, the demographic groups most similar to Belgians are Luxembourger (97.9%, a difference of 0.0%), Latvian (97.9%, a difference of 0.010%), Italian (97.9%, a difference of 0.020%), British (97.9%, a difference of 0.020%), and Chinese (97.9%, a difference of 0.030%).
| Demographics | Rating | Rank | 6th Grade |
| Europeans | 100.0 /100 | #31 | Exceptional 98.0% |
| Alaska Natives | 100.0 /100 | #32 | Exceptional 98.0% |
| Chippewa | 100.0 /100 | #33 | Exceptional 97.9% |
| Swiss | 100.0 /100 | #34 | Exceptional 97.9% |
| Chinese | 100.0 /100 | #35 | Exceptional 97.9% |
| Italians | 100.0 /100 | #36 | Exceptional 97.9% |
| British | 100.0 /100 | #37 | Exceptional 97.9% |
| Belgians | 100.0 /100 | #38 | Exceptional 97.9% |
| Luxembourgers | 99.9 /100 | #39 | Exceptional 97.9% |
| Latvians | 99.9 /100 | #40 | Exceptional 97.9% |
| Eastern Europeans | 99.9 /100 | #41 | Exceptional 97.9% |
| Hungarians | 99.9 /100 | #42 | Exceptional 97.8% |
| Northern Europeans | 99.9 /100 | #43 | Exceptional 97.8% |
| Czechoslovakians | 99.9 /100 | #44 | Exceptional 97.8% |
| Bulgarians | 99.9 /100 | #45 | Exceptional 97.8% |