Immigrants from North America vs Bahamian 3rd Grade
COMPARE
Immigrants from North America
Bahamian
3rd Grade
3rd Grade Comparison
Immigrants from North America
Bahamians
98.2%
3RD GRADE
99.7/ 100
METRIC RATING
63rd/ 347
METRIC RANK
97.5%
3RD GRADE
4.4/ 100
METRIC RATING
224th/ 347
METRIC RANK
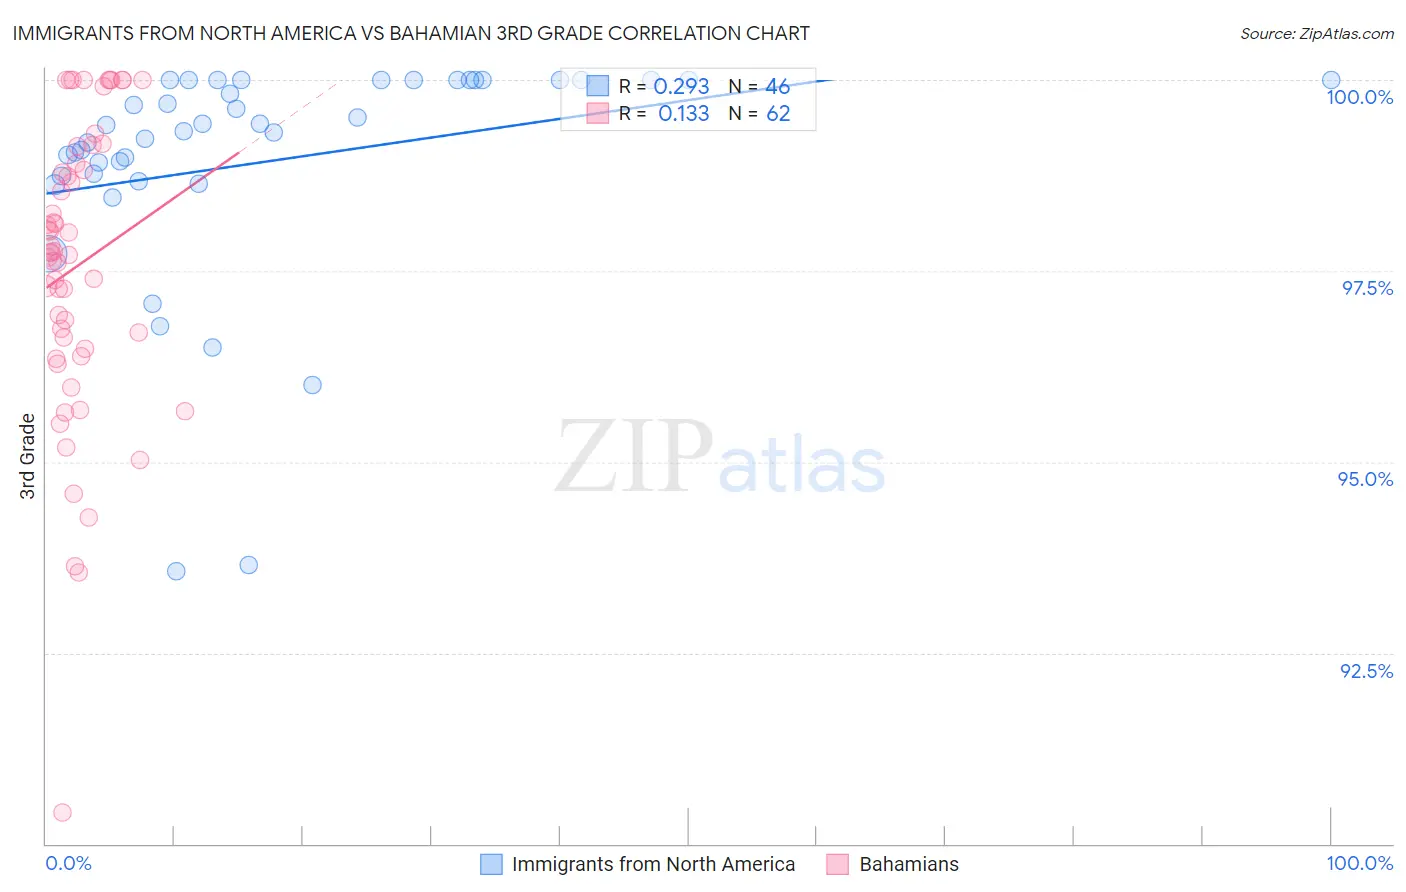
Immigrants from North America vs Bahamian 3rd Grade Correlation Chart
The statistical analysis conducted on geographies consisting of 462,462,400 people shows a weak positive correlation between the proportion of Immigrants from North America and percentage of population with at least 3rd grade education in the United States with a correlation coefficient (R) of 0.293 and weighted average of 98.2%. Similarly, the statistical analysis conducted on geographies consisting of 112,697,105 people shows a poor positive correlation between the proportion of Bahamians and percentage of population with at least 3rd grade education in the United States with a correlation coefficient (R) of 0.133 and weighted average of 97.5%, a difference of 0.75%.
3rd Grade Correlation Summary
| Measurement | Immigrants from North America | Bahamian |
| Minimum | 93.6% | 90.4% |
| Maximum | 100.0% | 100.0% |
| Range | 6.4% | 9.6% |
| Mean | 98.9% | 97.6% |
| Median | 99.4% | 97.7% |
| Interquartile 25% (IQ1) | 98.7% | 96.5% |
| Interquartile 75% (IQ3) | 100.0% | 98.9% |
| Interquartile Range (IQR) | 1.3% | 2.4% |
| Standard Deviation (Sample) | 1.5% | 1.9% |
| Standard Deviation (Population) | 1.5% | 1.9% |
Similar Demographics by 3rd Grade
Demographics Similar to Immigrants from North America by 3rd Grade
In terms of 3rd grade, the demographic groups most similar to Immigrants from North America are Greek (98.3%, a difference of 0.010%), Maltese (98.3%, a difference of 0.010%), Creek (98.2%, a difference of 0.010%), Pueblo (98.2%, a difference of 0.010%), and Immigrants from Canada (98.2%, a difference of 0.010%).
| Demographics | Rating | Rank | 3rd Grade |
| Austrians | 99.8 /100 | #56 | Exceptional 98.3% |
| Slavs | 99.7 /100 | #57 | Exceptional 98.3% |
| Greeks | 99.7 /100 | #58 | Exceptional 98.3% |
| Maltese | 99.7 /100 | #59 | Exceptional 98.3% |
| Creek | 99.7 /100 | #60 | Exceptional 98.2% |
| Pueblo | 99.7 /100 | #61 | Exceptional 98.2% |
| Immigrants | Canada | 99.7 /100 | #62 | Exceptional 98.2% |
| Immigrants | North America | 99.7 /100 | #63 | Exceptional 98.2% |
| Kiowa | 99.6 /100 | #64 | Exceptional 98.2% |
| New Zealanders | 99.6 /100 | #65 | Exceptional 98.2% |
| Serbians | 99.6 /100 | #66 | Exceptional 98.2% |
| Russians | 99.6 /100 | #67 | Exceptional 98.2% |
| Immigrants | Northern Europe | 99.6 /100 | #68 | Exceptional 98.2% |
| Canadians | 99.6 /100 | #69 | Exceptional 98.2% |
| Cajuns | 99.6 /100 | #70 | Exceptional 98.2% |
Demographics Similar to Bahamians by 3rd Grade
In terms of 3rd grade, the demographic groups most similar to Bahamians are Sierra Leonean (97.5%, a difference of 0.0%), Immigrants from Syria (97.5%, a difference of 0.0%), Tongan (97.5%, a difference of 0.0%), Immigrants from Morocco (97.5%, a difference of 0.010%), and Uruguayan (97.5%, a difference of 0.010%).
| Demographics | Rating | Rank | 3rd Grade |
| South American Indians | 5.7 /100 | #217 | Tragic 97.5% |
| Immigrants | Nepal | 5.3 /100 | #218 | Tragic 97.5% |
| Immigrants | Panama | 5.2 /100 | #219 | Tragic 97.5% |
| Immigrants | Morocco | 5.0 /100 | #220 | Tragic 97.5% |
| Uruguayans | 5.0 /100 | #221 | Tragic 97.5% |
| Sierra Leoneans | 4.6 /100 | #222 | Tragic 97.5% |
| Immigrants | Syria | 4.4 /100 | #223 | Tragic 97.5% |
| Bahamians | 4.4 /100 | #224 | Tragic 97.5% |
| Tongans | 4.3 /100 | #225 | Tragic 97.5% |
| Sudanese | 4.1 /100 | #226 | Tragic 97.5% |
| Immigrants | Sudan | 3.4 /100 | #227 | Tragic 97.5% |
| Sub-Saharan Africans | 3.2 /100 | #228 | Tragic 97.5% |
| Senegalese | 3.0 /100 | #229 | Tragic 97.5% |
| Immigrants | Pakistan | 2.7 /100 | #230 | Tragic 97.5% |
| Immigrants | Costa Rica | 2.7 /100 | #231 | Tragic 97.5% |