Immigrants from North America vs Croatian 6th Grade
COMPARE
Immigrants from North America
Croatian
6th Grade
6th Grade Comparison
Immigrants from North America
Croatians
97.7%
6TH GRADE
99.7/ 100
METRIC RATING
62nd/ 347
METRIC RANK
98.0%
6TH GRADE
100.0/ 100
METRIC RATING
24th/ 347
METRIC RANK
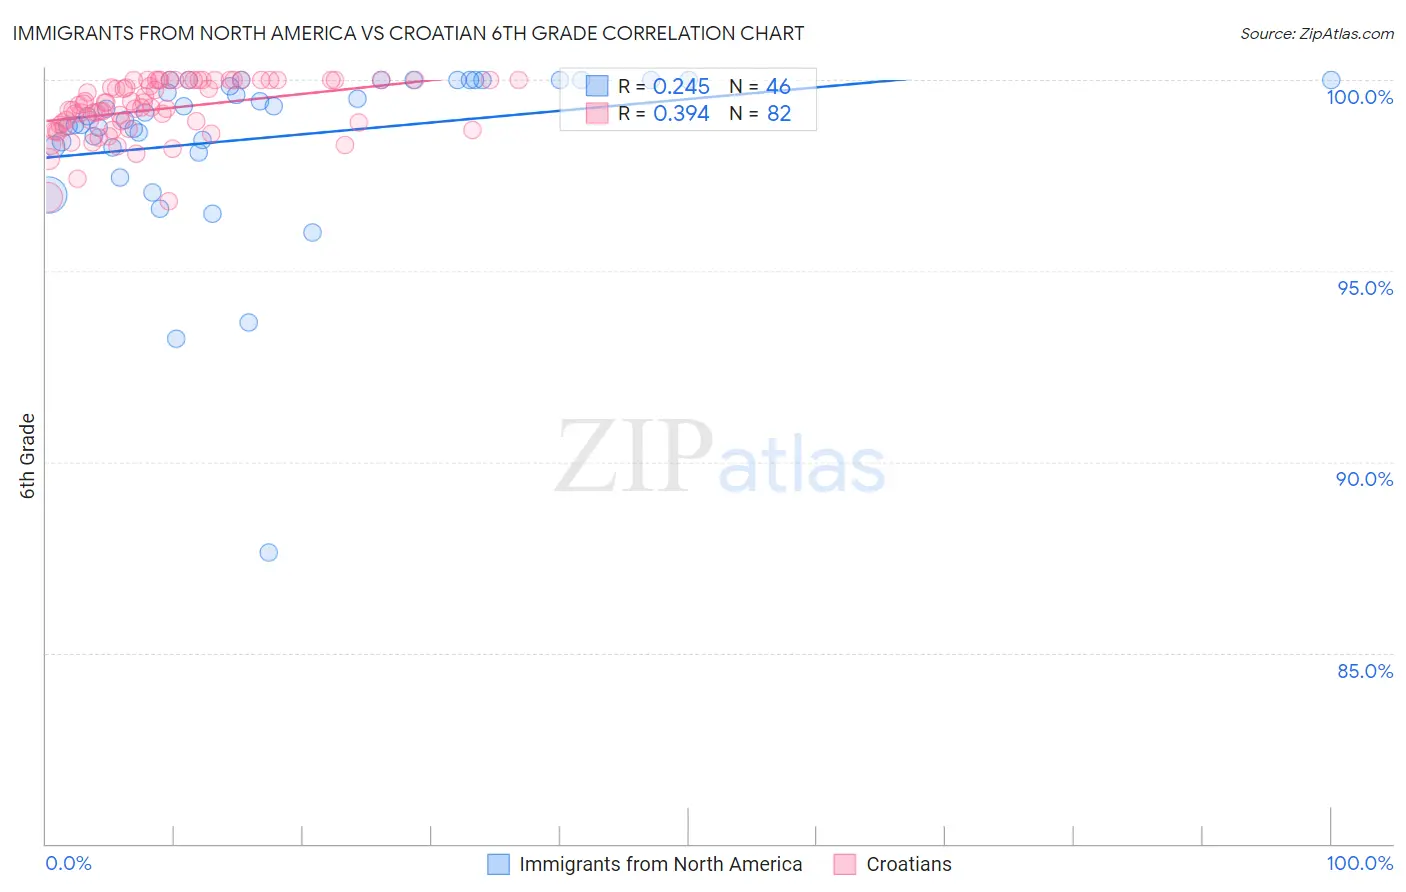
Immigrants from North America vs Croatian 6th Grade Correlation Chart
The statistical analysis conducted on geographies consisting of 462,462,330 people shows a weak positive correlation between the proportion of Immigrants from North America and percentage of population with at least 6th grade education in the United States with a correlation coefficient (R) of 0.245 and weighted average of 97.7%. Similarly, the statistical analysis conducted on geographies consisting of 375,733,612 people shows a mild positive correlation between the proportion of Croatians and percentage of population with at least 6th grade education in the United States with a correlation coefficient (R) of 0.394 and weighted average of 98.0%, a difference of 0.34%.
6th Grade Correlation Summary
| Measurement | Immigrants from North America | Croatian |
| Minimum | 87.6% | 96.8% |
| Maximum | 100.0% | 100.0% |
| Range | 12.4% | 3.2% |
| Mean | 98.5% | 99.2% |
| Median | 99.1% | 99.3% |
| Interquartile 25% (IQ1) | 98.3% | 98.8% |
| Interquartile 75% (IQ3) | 100.0% | 100.0% |
| Interquartile Range (IQR) | 1.7% | 1.2% |
| Standard Deviation (Sample) | 2.3% | 0.74% |
| Standard Deviation (Population) | 2.2% | 0.73% |
Similar Demographics by 6th Grade
Demographics Similar to Immigrants from North America by 6th Grade
In terms of 6th grade, the demographic groups most similar to Immigrants from North America are Immigrants from Canada (97.7%, a difference of 0.010%), Serbian (97.7%, a difference of 0.010%), Russian (97.7%, a difference of 0.010%), Greek (97.7%, a difference of 0.020%), and American (97.7%, a difference of 0.020%).
| Demographics | Rating | Rank | 6th Grade |
| Aleuts | 99.8 /100 | #55 | Exceptional 97.7% |
| Austrians | 99.8 /100 | #56 | Exceptional 97.7% |
| Whites/Caucasians | 99.8 /100 | #57 | Exceptional 97.7% |
| Greeks | 99.8 /100 | #58 | Exceptional 97.7% |
| Americans | 99.8 /100 | #59 | Exceptional 97.7% |
| Immigrants | Canada | 99.8 /100 | #60 | Exceptional 97.7% |
| Serbians | 99.7 /100 | #61 | Exceptional 97.7% |
| Immigrants | North America | 99.7 /100 | #62 | Exceptional 97.7% |
| Russians | 99.7 /100 | #63 | Exceptional 97.7% |
| Canadians | 99.7 /100 | #64 | Exceptional 97.7% |
| Immigrants | Northern Europe | 99.6 /100 | #65 | Exceptional 97.7% |
| New Zealanders | 99.6 /100 | #66 | Exceptional 97.7% |
| Kiowa | 99.6 /100 | #67 | Exceptional 97.7% |
| Immigrants | Austria | 99.6 /100 | #68 | Exceptional 97.7% |
| Iranians | 99.6 /100 | #69 | Exceptional 97.6% |
Demographics Similar to Croatians by 6th Grade
In terms of 6th grade, the demographic groups most similar to Croatians are Danish (98.0%, a difference of 0.010%), Sioux (98.0%, a difference of 0.010%), Scotch-Irish (98.0%, a difference of 0.010%), Czech (98.0%, a difference of 0.020%), and Lithuanian (98.1%, a difference of 0.030%).
| Demographics | Rating | Rank | 6th Grade |
| Poles | 100.0 /100 | #17 | Exceptional 98.1% |
| Pennsylvania Germans | 100.0 /100 | #18 | Exceptional 98.1% |
| Irish | 100.0 /100 | #19 | Exceptional 98.1% |
| Finns | 100.0 /100 | #20 | Exceptional 98.1% |
| Lithuanians | 100.0 /100 | #21 | Exceptional 98.1% |
| Danes | 100.0 /100 | #22 | Exceptional 98.0% |
| Sioux | 100.0 /100 | #23 | Exceptional 98.0% |
| Croatians | 100.0 /100 | #24 | Exceptional 98.0% |
| Scotch-Irish | 100.0 /100 | #25 | Exceptional 98.0% |
| Czechs | 100.0 /100 | #26 | Exceptional 98.0% |
| Yup'ik | 100.0 /100 | #27 | Exceptional 98.0% |
| Scandinavians | 100.0 /100 | #28 | Exceptional 98.0% |
| French | 100.0 /100 | #29 | Exceptional 98.0% |
| French Canadians | 100.0 /100 | #30 | Exceptional 98.0% |
| Europeans | 100.0 /100 | #31 | Exceptional 98.0% |