Dutch West Indian vs Alaska Native 2nd Grade
COMPARE
Dutch West Indian
Alaska Native
2nd Grade
2nd Grade Comparison
Dutch West Indians
Alaska Natives
97.9%
2ND GRADE
63.8/ 100
METRIC RATING
156th/ 347
METRIC RANK
98.7%
2ND GRADE
100.0/ 100
METRIC RATING
6th/ 347
METRIC RANK
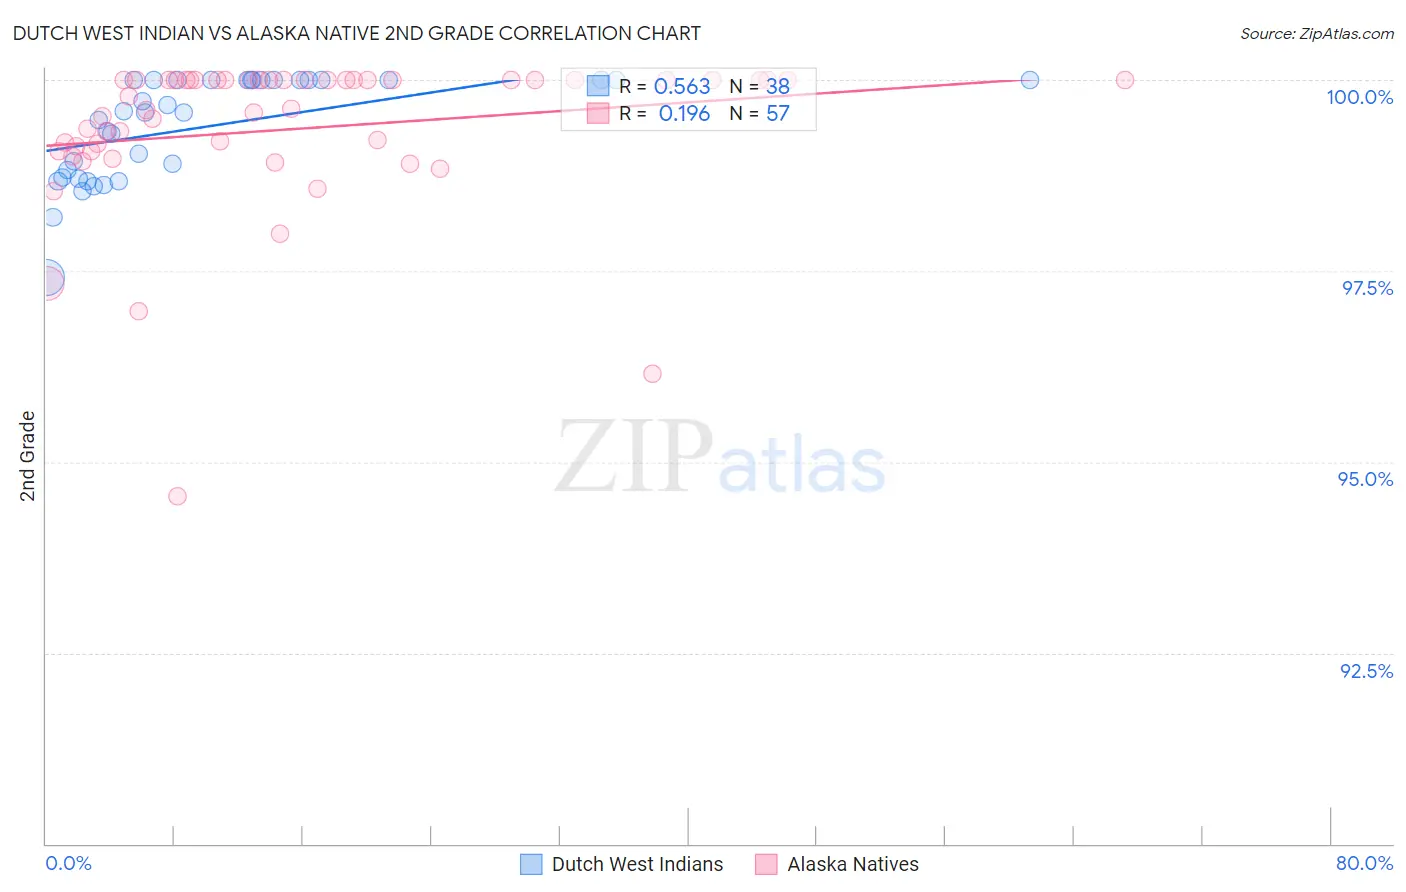
Dutch West Indian vs Alaska Native 2nd Grade Correlation Chart
The statistical analysis conducted on geographies consisting of 85,776,075 people shows a substantial positive correlation between the proportion of Dutch West Indians and percentage of population with at least 2nd grade education in the United States with a correlation coefficient (R) of 0.563 and weighted average of 97.9%. Similarly, the statistical analysis conducted on geographies consisting of 76,775,774 people shows a poor positive correlation between the proportion of Alaska Natives and percentage of population with at least 2nd grade education in the United States with a correlation coefficient (R) of 0.196 and weighted average of 98.7%, a difference of 0.79%.
2nd Grade Correlation Summary
| Measurement | Dutch West Indian | Alaska Native |
| Minimum | 97.4% | 94.6% |
| Maximum | 100.0% | 100.0% |
| Range | 2.6% | 5.4% |
| Mean | 99.4% | 99.4% |
| Median | 99.6% | 99.8% |
| Interquartile 25% (IQ1) | 98.7% | 99.1% |
| Interquartile 75% (IQ3) | 100.0% | 100.0% |
| Interquartile Range (IQR) | 1.3% | 0.93% |
| Standard Deviation (Sample) | 0.67% | 1.0% |
| Standard Deviation (Population) | 0.67% | 1.0% |
Similar Demographics by 2nd Grade
Demographics Similar to Dutch West Indians by 2nd Grade
In terms of 2nd grade, the demographic groups most similar to Dutch West Indians are French American Indian (97.9%, a difference of 0.0%), Venezuelan (97.9%, a difference of 0.0%), Immigrants from Iran (97.9%, a difference of 0.0%), Comanche (97.9%, a difference of 0.0%), and Marshallese (97.9%, a difference of 0.010%).
| Demographics | Rating | Rank | 2nd Grade |
| Apache | 74.0 /100 | #149 | Good 97.9% |
| Immigrants | Moldova | 72.9 /100 | #150 | Good 97.9% |
| Soviet Union | 70.7 /100 | #151 | Good 97.9% |
| Immigrants | North Macedonia | 68.5 /100 | #152 | Good 97.9% |
| Immigrants | South Central Asia | 68.3 /100 | #153 | Good 97.9% |
| Marshallese | 67.7 /100 | #154 | Good 97.9% |
| French American Indians | 64.3 /100 | #155 | Good 97.9% |
| Dutch West Indians | 63.8 /100 | #156 | Good 97.9% |
| Venezuelans | 63.3 /100 | #157 | Good 97.9% |
| Immigrants | Iran | 62.8 /100 | #158 | Good 97.9% |
| Comanche | 62.8 /100 | #159 | Good 97.9% |
| Immigrants | Eastern Europe | 61.1 /100 | #160 | Good 97.9% |
| Immigrants | Russia | 60.3 /100 | #161 | Good 97.9% |
| Immigrants | Italy | 60.2 /100 | #162 | Good 97.9% |
| Bermudans | 59.4 /100 | #163 | Average 97.9% |
Demographics Similar to Alaska Natives by 2nd Grade
In terms of 2nd grade, the demographic groups most similar to Alaska Natives are Norwegian (98.7%, a difference of 0.010%), German (98.7%, a difference of 0.030%), Slovak (98.7%, a difference of 0.030%), Alaskan Athabascan (98.7%, a difference of 0.040%), and Slovene (98.6%, a difference of 0.050%).
| Demographics | Rating | Rank | 2nd Grade |
| Crow | 100.0 /100 | #1 | Exceptional 99.6% |
| Yup'ik | 100.0 /100 | #2 | Exceptional 99.2% |
| Inupiat | 100.0 /100 | #3 | Exceptional 98.8% |
| Tsimshian | 100.0 /100 | #4 | Exceptional 98.8% |
| Alaskan Athabascans | 100.0 /100 | #5 | Exceptional 98.7% |
| Alaska Natives | 100.0 /100 | #6 | Exceptional 98.7% |
| Norwegians | 100.0 /100 | #7 | Exceptional 98.7% |
| Germans | 100.0 /100 | #8 | Exceptional 98.7% |
| Slovaks | 100.0 /100 | #9 | Exceptional 98.7% |
| Slovenes | 100.0 /100 | #10 | Exceptional 98.6% |
| Tlingit-Haida | 100.0 /100 | #11 | Exceptional 98.6% |
| Carpatho Rusyns | 100.0 /100 | #12 | Exceptional 98.6% |
| English | 100.0 /100 | #13 | Exceptional 98.6% |
| Swedes | 100.0 /100 | #14 | Exceptional 98.6% |
| Scottish | 100.0 /100 | #15 | Exceptional 98.6% |