Cypriot vs Alaska Native 2nd Grade
COMPARE
Cypriot
Alaska Native
2nd Grade
2nd Grade Comparison
Cypriots
Alaska Natives
98.2%
2ND GRADE
98.4/ 100
METRIC RATING
96th/ 347
METRIC RANK
98.7%
2ND GRADE
100.0/ 100
METRIC RATING
6th/ 347
METRIC RANK
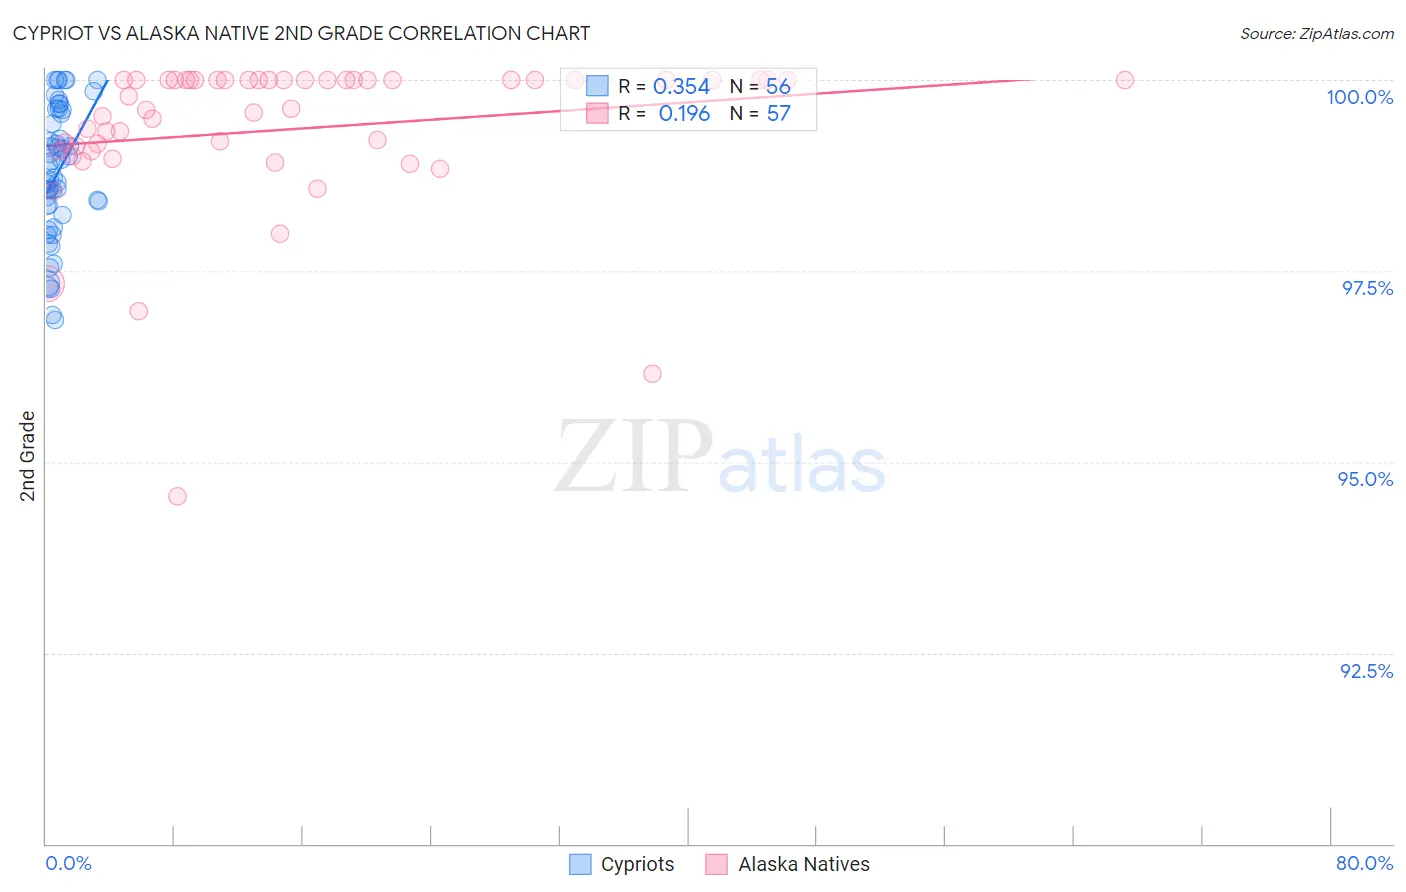
Cypriot vs Alaska Native 2nd Grade Correlation Chart
The statistical analysis conducted on geographies consisting of 61,867,249 people shows a mild positive correlation between the proportion of Cypriots and percentage of population with at least 2nd grade education in the United States with a correlation coefficient (R) of 0.354 and weighted average of 98.2%. Similarly, the statistical analysis conducted on geographies consisting of 76,775,774 people shows a poor positive correlation between the proportion of Alaska Natives and percentage of population with at least 2nd grade education in the United States with a correlation coefficient (R) of 0.196 and weighted average of 98.7%, a difference of 0.51%.
2nd Grade Correlation Summary
| Measurement | Cypriot | Alaska Native |
| Minimum | 96.9% | 94.6% |
| Maximum | 100.0% | 100.0% |
| Range | 3.1% | 5.4% |
| Mean | 98.8% | 99.4% |
| Median | 98.8% | 99.8% |
| Interquartile 25% (IQ1) | 98.3% | 99.1% |
| Interquartile 75% (IQ3) | 99.6% | 100.0% |
| Interquartile Range (IQR) | 1.3% | 0.93% |
| Standard Deviation (Sample) | 0.85% | 1.0% |
| Standard Deviation (Population) | 0.85% | 1.0% |
Similar Demographics by 2nd Grade
Demographics Similar to Cypriots by 2nd Grade
In terms of 2nd grade, the demographic groups most similar to Cypriots are Immigrants from Germany (98.2%, a difference of 0.010%), South African (98.2%, a difference of 0.010%), Choctaw (98.2%, a difference of 0.010%), Nonimmigrants (98.2%, a difference of 0.010%), and Zimbabwean (98.2%, a difference of 0.020%).
| Demographics | Rating | Rank | 2nd Grade |
| Ukrainians | 98.9 /100 | #89 | Exceptional 98.2% |
| Zimbabweans | 98.8 /100 | #90 | Exceptional 98.2% |
| Immigrants | Western Europe | 98.8 /100 | #91 | Exceptional 98.2% |
| Immigrants | South Africa | 98.8 /100 | #92 | Exceptional 98.2% |
| Immigrants | India | 98.8 /100 | #93 | Exceptional 98.2% |
| Immigrants | Germany | 98.6 /100 | #94 | Exceptional 98.2% |
| South Africans | 98.6 /100 | #95 | Exceptional 98.2% |
| Cypriots | 98.4 /100 | #96 | Exceptional 98.2% |
| Choctaw | 98.3 /100 | #97 | Exceptional 98.2% |
| Immigrants | Nonimmigrants | 98.3 /100 | #98 | Exceptional 98.2% |
| Immigrants | Ireland | 98.0 /100 | #99 | Exceptional 98.2% |
| Romanians | 98.0 /100 | #100 | Exceptional 98.2% |
| Puget Sound Salish | 98.0 /100 | #101 | Exceptional 98.2% |
| Cree | 98.0 /100 | #102 | Exceptional 98.2% |
| Pima | 97.6 /100 | #103 | Exceptional 98.2% |
Demographics Similar to Alaska Natives by 2nd Grade
In terms of 2nd grade, the demographic groups most similar to Alaska Natives are Norwegian (98.7%, a difference of 0.010%), German (98.7%, a difference of 0.030%), Slovak (98.7%, a difference of 0.030%), Alaskan Athabascan (98.7%, a difference of 0.040%), and Slovene (98.6%, a difference of 0.050%).
| Demographics | Rating | Rank | 2nd Grade |
| Crow | 100.0 /100 | #1 | Exceptional 99.6% |
| Yup'ik | 100.0 /100 | #2 | Exceptional 99.2% |
| Inupiat | 100.0 /100 | #3 | Exceptional 98.8% |
| Tsimshian | 100.0 /100 | #4 | Exceptional 98.8% |
| Alaskan Athabascans | 100.0 /100 | #5 | Exceptional 98.7% |
| Alaska Natives | 100.0 /100 | #6 | Exceptional 98.7% |
| Norwegians | 100.0 /100 | #7 | Exceptional 98.7% |
| Germans | 100.0 /100 | #8 | Exceptional 98.7% |
| Slovaks | 100.0 /100 | #9 | Exceptional 98.7% |
| Slovenes | 100.0 /100 | #10 | Exceptional 98.6% |
| Tlingit-Haida | 100.0 /100 | #11 | Exceptional 98.6% |
| Carpatho Rusyns | 100.0 /100 | #12 | Exceptional 98.6% |
| English | 100.0 /100 | #13 | Exceptional 98.6% |
| Swedes | 100.0 /100 | #14 | Exceptional 98.6% |
| Scottish | 100.0 /100 | #15 | Exceptional 98.6% |