Immigrants from Nigeria vs European 2nd Grade
COMPARE
Immigrants from Nigeria
European
2nd Grade
2nd Grade Comparison
Immigrants from Nigeria
Europeans
97.4%
2ND GRADE
0.3/ 100
METRIC RATING
268th/ 347
METRIC RANK
98.5%
2ND GRADE
100.0/ 100
METRIC RATING
30th/ 347
METRIC RANK
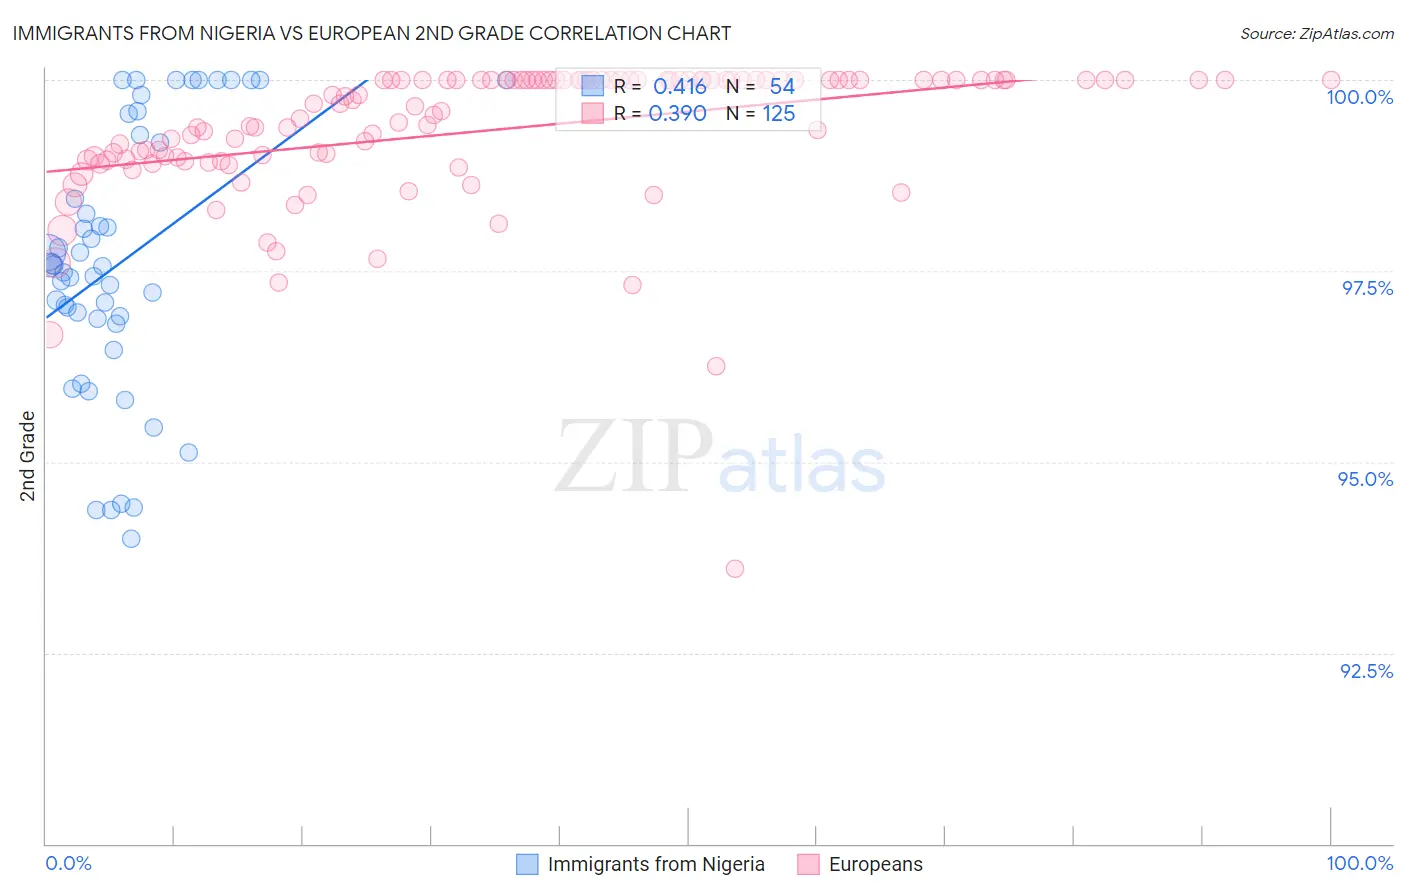
Immigrants from Nigeria vs European 2nd Grade Correlation Chart
The statistical analysis conducted on geographies consisting of 283,430,369 people shows a moderate positive correlation between the proportion of Immigrants from Nigeria and percentage of population with at least 2nd grade education in the United States with a correlation coefficient (R) of 0.416 and weighted average of 97.4%. Similarly, the statistical analysis conducted on geographies consisting of 561,829,544 people shows a mild positive correlation between the proportion of Europeans and percentage of population with at least 2nd grade education in the United States with a correlation coefficient (R) of 0.390 and weighted average of 98.5%, a difference of 1.1%.
2nd Grade Correlation Summary
| Measurement | Immigrants from Nigeria | European |
| Minimum | 94.0% | 93.6% |
| Maximum | 100.0% | 100.0% |
| Range | 6.0% | 6.4% |
| Mean | 97.6% | 99.3% |
| Median | 97.6% | 99.7% |
| Interquartile 25% (IQ1) | 96.9% | 99.0% |
| Interquartile 75% (IQ3) | 99.3% | 100.0% |
| Interquartile Range (IQR) | 2.4% | 1.0% |
| Standard Deviation (Sample) | 1.7% | 0.94% |
| Standard Deviation (Population) | 1.7% | 0.93% |
Similar Demographics by 2nd Grade
Demographics Similar to Immigrants from Nigeria by 2nd Grade
In terms of 2nd grade, the demographic groups most similar to Immigrants from Nigeria are Cuban (97.4%, a difference of 0.0%), West Indian (97.4%, a difference of 0.0%), Immigrants from Liberia (97.4%, a difference of 0.020%), Immigrants from South America (97.4%, a difference of 0.020%), and Immigrants from Sierra Leone (97.4%, a difference of 0.020%).
| Demographics | Rating | Rank | 2nd Grade |
| Armenians | 0.5 /100 | #261 | Tragic 97.5% |
| Taiwanese | 0.4 /100 | #262 | Tragic 97.4% |
| Immigrants | Ethiopia | 0.4 /100 | #263 | Tragic 97.4% |
| Immigrants | Liberia | 0.4 /100 | #264 | Tragic 97.4% |
| Immigrants | South America | 0.4 /100 | #265 | Tragic 97.4% |
| Immigrants | Sierra Leone | 0.4 /100 | #266 | Tragic 97.4% |
| Cubans | 0.3 /100 | #267 | Tragic 97.4% |
| Immigrants | Nigeria | 0.3 /100 | #268 | Tragic 97.4% |
| West Indians | 0.3 /100 | #269 | Tragic 97.4% |
| Immigrants | Jamaica | 0.2 /100 | #270 | Tragic 97.4% |
| Immigrants | Cameroon | 0.2 /100 | #271 | Tragic 97.4% |
| Immigrants | Peru | 0.1 /100 | #272 | Tragic 97.4% |
| Immigrants | Bolivia | 0.1 /100 | #273 | Tragic 97.4% |
| Ghanaians | 0.1 /100 | #274 | Tragic 97.4% |
| Immigrants | China | 0.1 /100 | #275 | Tragic 97.3% |
Demographics Similar to Europeans by 2nd Grade
In terms of 2nd grade, the demographic groups most similar to Europeans are Czech (98.5%, a difference of 0.0%), French Canadian (98.5%, a difference of 0.0%), Croatian (98.5%, a difference of 0.010%), Arapaho (98.5%, a difference of 0.010%), and French (98.5%, a difference of 0.010%).
| Demographics | Rating | Rank | 2nd Grade |
| Danes | 100.0 /100 | #23 | Exceptional 98.5% |
| Pennsylvania Germans | 100.0 /100 | #24 | Exceptional 98.5% |
| Scotch-Irish | 100.0 /100 | #25 | Exceptional 98.5% |
| Welsh | 100.0 /100 | #26 | Exceptional 98.5% |
| Croatians | 100.0 /100 | #27 | Exceptional 98.5% |
| Arapaho | 100.0 /100 | #28 | Exceptional 98.5% |
| French | 100.0 /100 | #29 | Exceptional 98.5% |
| Europeans | 100.0 /100 | #30 | Exceptional 98.5% |
| Czechs | 100.0 /100 | #31 | Exceptional 98.5% |
| French Canadians | 100.0 /100 | #32 | Exceptional 98.5% |
| Scandinavians | 100.0 /100 | #33 | Exceptional 98.5% |
| Chinese | 100.0 /100 | #34 | Exceptional 98.5% |
| Swiss | 100.0 /100 | #35 | Exceptional 98.5% |
| British | 100.0 /100 | #36 | Exceptional 98.5% |
| Italians | 99.9 /100 | #37 | Exceptional 98.4% |