Immigrants from Europe vs Ottawa College, 1 year or more
COMPARE
Immigrants from Europe
Ottawa
College, 1 year or more
College, 1 year or more Comparison
Immigrants from Europe
Ottawa
63.3%
COLLEGE, 1 YEAR OR MORE
99.3/ 100
METRIC RATING
66th/ 347
METRIC RANK
54.9%
COLLEGE, 1 YEAR OR MORE
0.3/ 100
METRIC RATING
261st/ 347
METRIC RANK
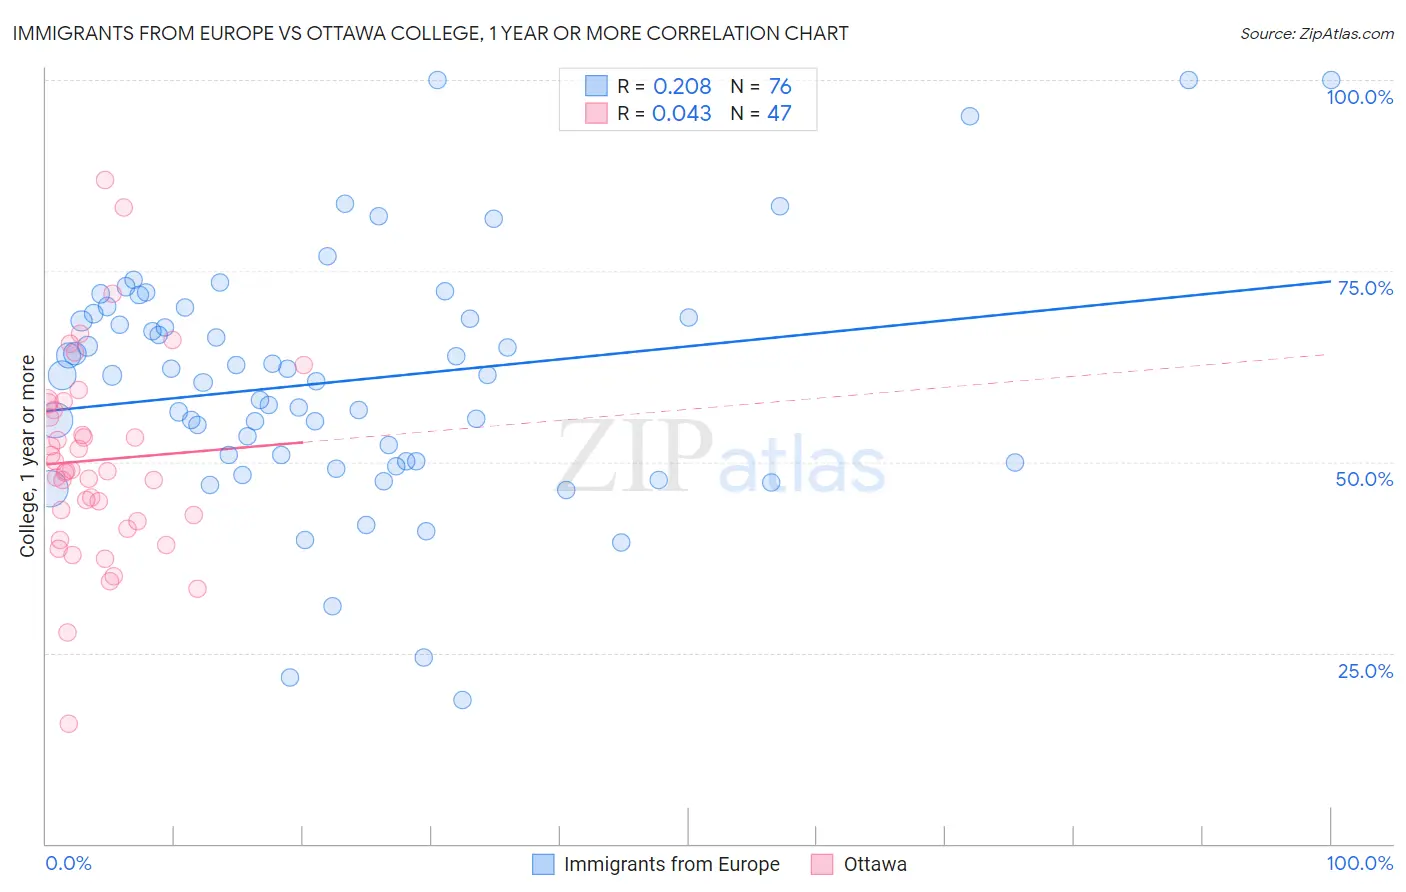
Immigrants from Europe vs Ottawa College, 1 year or more Correlation Chart
The statistical analysis conducted on geographies consisting of 547,418,471 people shows a weak positive correlation between the proportion of Immigrants from Europe and percentage of population with at least college, 1 year or more education in the United States with a correlation coefficient (R) of 0.208 and weighted average of 63.3%. Similarly, the statistical analysis conducted on geographies consisting of 49,956,602 people shows no correlation between the proportion of Ottawa and percentage of population with at least college, 1 year or more education in the United States with a correlation coefficient (R) of 0.043 and weighted average of 54.9%, a difference of 15.4%.
College, 1 year or more Correlation Summary
| Measurement | Immigrants from Europe | Ottawa |
| Minimum | 18.8% | 15.7% |
| Maximum | 100.0% | 86.9% |
| Range | 81.2% | 71.3% |
| Mean | 60.6% | 50.2% |
| Median | 61.4% | 48.8% |
| Interquartile 25% (IQ1) | 50.0% | 42.2% |
| Interquartile 75% (IQ3) | 69.1% | 57.7% |
| Interquartile Range (IQR) | 19.1% | 15.5% |
| Standard Deviation (Sample) | 16.1% | 13.1% |
| Standard Deviation (Population) | 15.9% | 13.0% |
Similar Demographics by College, 1 year or more
Demographics Similar to Immigrants from Europe by College, 1 year or more
In terms of college, 1 year or more, the demographic groups most similar to Immigrants from Europe are Immigrants from Romania (63.3%, a difference of 0.020%), Immigrants from Greece (63.3%, a difference of 0.030%), Immigrants from Zimbabwe (63.3%, a difference of 0.040%), Maltese (63.4%, a difference of 0.10%), and Argentinean (63.2%, a difference of 0.13%).
| Demographics | Rating | Rank | College, 1 year or more |
| Immigrants | Serbia | 99.6 /100 | #59 | Exceptional 63.8% |
| Immigrants | Kazakhstan | 99.5 /100 | #60 | Exceptional 63.6% |
| Bolivians | 99.5 /100 | #61 | Exceptional 63.5% |
| Immigrants | Indonesia | 99.5 /100 | #62 | Exceptional 63.5% |
| Immigrants | Scotland | 99.4 /100 | #63 | Exceptional 63.4% |
| Immigrants | Spain | 99.4 /100 | #64 | Exceptional 63.4% |
| Maltese | 99.3 /100 | #65 | Exceptional 63.4% |
| Immigrants | Europe | 99.3 /100 | #66 | Exceptional 63.3% |
| Immigrants | Romania | 99.3 /100 | #67 | Exceptional 63.3% |
| Immigrants | Greece | 99.3 /100 | #68 | Exceptional 63.3% |
| Immigrants | Zimbabwe | 99.3 /100 | #69 | Exceptional 63.3% |
| Argentineans | 99.2 /100 | #70 | Exceptional 63.2% |
| Immigrants | Canada | 99.1 /100 | #71 | Exceptional 63.1% |
| Egyptians | 99.0 /100 | #72 | Exceptional 63.1% |
| Immigrants | Moldova | 99.0 /100 | #73 | Exceptional 63.0% |
Demographics Similar to Ottawa by College, 1 year or more
In terms of college, 1 year or more, the demographic groups most similar to Ottawa are Jamaican (54.9%, a difference of 0.030%), Immigrants from St. Vincent and the Grenadines (54.8%, a difference of 0.080%), U.S. Virgin Islander (54.8%, a difference of 0.11%), Nepalese (54.9%, a difference of 0.13%), and Immigrants from Micronesia (54.8%, a difference of 0.13%).
| Demographics | Rating | Rank | College, 1 year or more |
| Japanese | 0.5 /100 | #254 | Tragic 55.2% |
| Immigrants | Bahamas | 0.5 /100 | #255 | Tragic 55.2% |
| Immigrants | West Indies | 0.5 /100 | #256 | Tragic 55.2% |
| Indonesians | 0.4 /100 | #257 | Tragic 55.1% |
| Africans | 0.4 /100 | #258 | Tragic 55.0% |
| Nepalese | 0.3 /100 | #259 | Tragic 54.9% |
| Jamaicans | 0.3 /100 | #260 | Tragic 54.9% |
| Ottawa | 0.3 /100 | #261 | Tragic 54.9% |
| Immigrants | St. Vincent and the Grenadines | 0.3 /100 | #262 | Tragic 54.8% |
| U.S. Virgin Islanders | 0.3 /100 | #263 | Tragic 54.8% |
| Immigrants | Micronesia | 0.3 /100 | #264 | Tragic 54.8% |
| Immigrants | Laos | 0.2 /100 | #265 | Tragic 54.7% |
| Potawatomi | 0.2 /100 | #266 | Tragic 54.6% |
| Blackfeet | 0.2 /100 | #267 | Tragic 54.6% |
| British West Indians | 0.2 /100 | #268 | Tragic 54.5% |