Immigrants from Middle Africa vs Immigrants from Nigeria Female Poverty Among 18-24 Year Olds

COMPARE

Immigrants from Middle Africa
Race
Ancestry
AfghanAfricanAlaska NativeAlaskan AthabascanAlbanianAleutAlsatianAmericanApacheArabArapahoArgentineanArmenianAssyrian/Chaldean/SyriacAustralianAustrianBahamianBangladeshiBarbadianBasqueBelgianBelizeanBermudanBhutaneseBlackfeetBolivianBrazilianBritishBritish West IndianBulgarianBurmeseCajunCambodianCanadianCape VerdeanCarpatho RusynCelticCentral AmericanCentral American IndianCherokeeCheyenneChickasawChileanChineseChippewaChoctawColombianColvilleComancheCosta RicanCreeCreekCroatianCrowCubanCypriotCzechCzechoslovakianDanishDelawareDominicanDutchDutch West IndianEastern EuropeanEcuadorianEgyptianEnglishEstonianEthiopianEuropeanFijianFilipinoFinnishFrenchFrench American IndianFrench CanadianGermanGerman RussianGhanaianGreekGuamanian/ChamorroGuatemalanGuyaneseHaitianHmongHonduranHopiHoumaHungarianIcelanderIndian (Asian)IndonesianInupiatIranianIraqiIrishIroquoisIsraeliItalianJamaicanJapaneseJordanianKenyanKiowaKoreanLaotianLatvianLebaneseLiberianLithuanianLumbeeLuxembourgerMacedonianMalaysianMalteseMarshalleseMenomineeMexicanMexican American IndianMongolianMoroccanNative HawaiianNavajoNepaleseNew ZealanderNicaraguanNigerianNorthern EuropeanNorwegianOkinawanOsageOttawaPaiutePakistaniPalestinianPanamanianParaguayanPennsylvania GermanPeruvianPimaPolishPortuguesePotawatomiPuebloPuerto RicanPuget Sound SalishRomanianRussianSalvadoranSamoanScandinavianScotch-IrishScottishSeminoleSenegaleseSerbianShoshoneSierra LeoneanSiouxSlavicSlovakSloveneSomaliSouth AfricanSouth AmericanSouth American IndianSoviet UnionSpaniardSpanishSpanish AmericanSpanish American IndianSri LankanSubsaharan AfricanSudaneseSwedishSwissSyrianTaiwaneseThaiTlingit-HaidaTohono O'OdhamTonganTrinidadian and TobagonianTsimshianTurkishU.S. Virgin IslanderUgandanUkrainianUruguayanUteVenezuelanVietnameseWelshWest IndianYakamaYaquiYugoslavianYumanYup'ikZimbabwean
Immigration
NonimmigrantsImmigrantsAfghanistanAfricaAlbaniaArgentinaArmeniaAsiaAustraliaAustriaBahamasBangladeshBarbadosBelarusBelgiumBelizeBoliviaBosnia and HerzegovinaBrazilBulgariaBurma/MyanmarCabo VerdeCambodiaCameroonCanadaCaribbeanCentral AmericaChileChinaColombiaCongoCosta RicaCroatiaCubaCzechoslovakiaDenmarkDominicaDominican RepublicEastern AfricaEastern AsiaEastern EuropeEcuadorEgyptEl SalvadorEnglandEritreaEthiopiaEuropeFijiFranceGermanyGhanaGreeceGrenadaGuatemalaGuyanaHaitiHondurasHong KongHungaryIndiaIndonesiaIranIraqIrelandIsraelItalyJamaicaJapanJordanKazakhstanKenyaKoreaKuwaitLaosLatin AmericaLatviaLebanonLiberiaLithuaniaMalaysiaMexicoMicronesiaMiddle AfricaMoldovaMoroccoNepalNetherlandsNicaraguaNorth AmericaNorth MacedoniaNorthern AfricaNorthern EuropeNorwayOceaniaPakistanPanamaPeruPhilippinesPolandPortugalRomaniaRussiaSaudi ArabiaScotlandSenegalSerbiaSierra LeoneSingaporeSomaliaSouth AfricaSouth AmericaSouth Central AsiaSouth Eastern AsiaSouthern EuropeSpainSri LankaSt. Vincent and the GrenadinesSudanSwedenSwitzerlandSyriaTaiwanThailandTrinidad and TobagoTurkeyUgandaUkraineUruguayUzbekistanVenezuelaVietnamWest IndiesWestern AfricaWestern AsiaWestern EuropeYemenZaireZimbabweAzores
Immigrants from Nigeria
Race
Ancestry
AfghanAfricanAlaska NativeAlaskan AthabascanAlbanianAleutAlsatianAmericanApacheArabArapahoArgentineanArmenianAssyrian/Chaldean/SyriacAustralianAustrianBahamianBangladeshiBarbadianBasqueBelgianBelizeanBermudanBhutaneseBlackfeetBolivianBrazilianBritishBritish West IndianBulgarianBurmeseCajunCambodianCanadianCape VerdeanCarpatho RusynCelticCentral AmericanCentral American IndianCherokeeCheyenneChickasawChileanChineseChippewaChoctawColombianColvilleComancheCosta RicanCreeCreekCroatianCrowCubanCypriotCzechCzechoslovakianDanishDelawareDominicanDutchDutch West IndianEastern EuropeanEcuadorianEgyptianEnglishEstonianEthiopianEuropeanFijianFilipinoFinnishFrenchFrench American IndianFrench CanadianGermanGerman RussianGhanaianGreekGuamanian/ChamorroGuatemalanGuyaneseHaitianHmongHonduranHopiHoumaHungarianIcelanderIndian (Asian)IndonesianInupiatIranianIraqiIrishIroquoisIsraeliItalianJamaicanJapaneseJordanianKenyanKiowaKoreanLaotianLatvianLebaneseLiberianLithuanianLumbeeLuxembourgerMacedonianMalaysianMalteseMarshalleseMenomineeMexicanMexican American IndianMongolianMoroccanNative HawaiianNavajoNepaleseNew ZealanderNicaraguanNigerianNorthern EuropeanNorwegianOkinawanOsageOttawaPaiutePakistaniPalestinianPanamanianParaguayanPennsylvania GermanPeruvianPimaPolishPortuguesePotawatomiPuebloPuerto RicanPuget Sound SalishRomanianRussianSalvadoranSamoanScandinavianScotch-IrishScottishSeminoleSenegaleseSerbianShoshoneSierra LeoneanSiouxSlavicSlovakSloveneSomaliSouth AfricanSouth AmericanSouth American IndianSoviet UnionSpaniardSpanishSpanish AmericanSpanish American IndianSri LankanSubsaharan AfricanSudaneseSwedishSwissSyrianTaiwaneseThaiTlingit-HaidaTohono O'OdhamTonganTrinidadian and TobagonianTsimshianTurkishU.S. Virgin IslanderUgandanUkrainianUruguayanUteVenezuelanVietnameseWelshWest IndianYakamaYaquiYugoslavianYumanYup'ikZimbabwean
Immigration
NonimmigrantsImmigrantsAfghanistanAfricaAlbaniaArgentinaArmeniaAsiaAustraliaAustriaBahamasBangladeshBarbadosBelarusBelgiumBelizeBoliviaBosnia and HerzegovinaBrazilBulgariaBurma/MyanmarCabo VerdeCambodiaCameroonCanadaCaribbeanCentral AmericaChileChinaColombiaCongoCosta RicaCroatiaCubaCzechoslovakiaDenmarkDominicaDominican RepublicEastern AfricaEastern AsiaEastern EuropeEcuadorEgyptEl SalvadorEnglandEritreaEthiopiaEuropeFijiFranceGermanyGhanaGreeceGrenadaGuatemalaGuyanaHaitiHondurasHong KongHungaryIndiaIndonesiaIranIraqIrelandIsraelItalyJamaicaJapanJordanKazakhstanKenyaKoreaKuwaitLaosLatin AmericaLatviaLebanonLiberiaLithuaniaMalaysiaMexicoMicronesiaMoldovaMoroccoNepalNetherlandsNicaraguaNigeriaNorth AmericaNorth MacedoniaNorthern AfricaNorthern EuropeNorwayOceaniaPakistanPanamaPeruPhilippinesPolandPortugalRomaniaRussiaSaudi ArabiaScotlandSenegalSerbiaSierra LeoneSingaporeSomaliaSouth AfricaSouth AmericaSouth Central AsiaSouth Eastern AsiaSouthern EuropeSpainSri LankaSt. Vincent and the GrenadinesSudanSwedenSwitzerlandSyriaTaiwanThailandTrinidad and TobagoTurkeyUgandaUkraineUruguayUzbekistanVenezuelaVietnamWest IndiesWestern AfricaWestern AsiaWestern EuropeYemenZaireZimbabweAzores
Female Poverty Among 18-24 Year Olds
Income
Poverty
Unemployment
Labor Participation
Family Structure
Vehicle Availability
Education Level
Disability

Female Poverty Among 18-24 Year Olds Comparison

Immigrants from Middle Africa

Immigrants from Nigeria

Tragic
Average
22.1%
FEMALE POVERTY AMONG 18-24 YEAR OLDS
0.0/ 100
METRIC RATING
287th/ 347
METRIC RANK
20.1%
FEMALE POVERTY AMONG 18-24 YEAR OLDS
54.3/ 100
METRIC RATING
171st/ 347
METRIC RANK

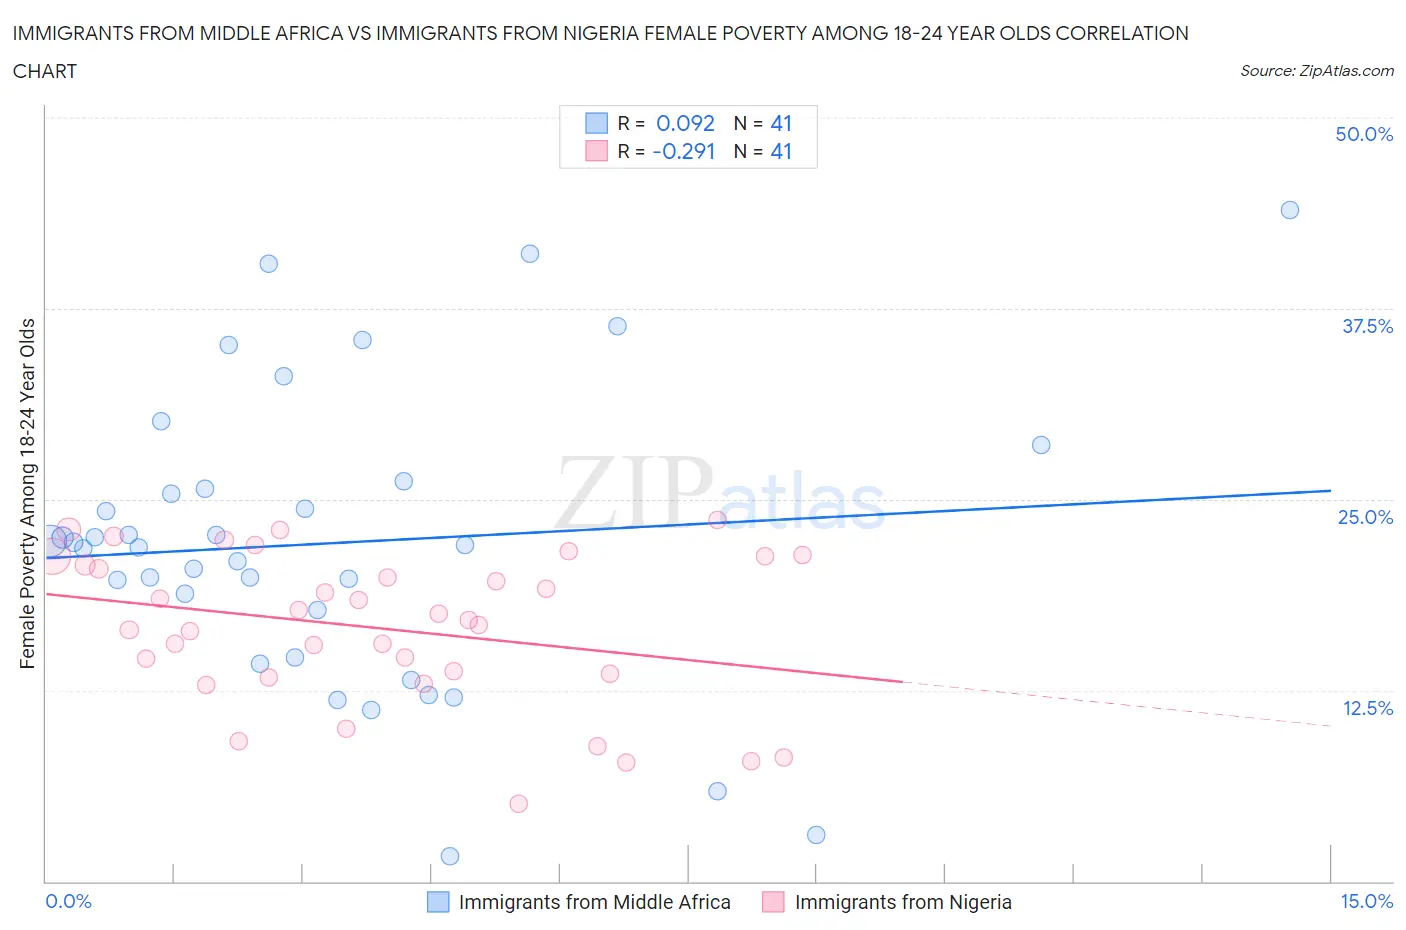
Immigrants from Middle Africa vs Immigrants from Nigeria Female Poverty Among 18-24 Year Olds Correlation Chart

The statistical analysis conducted on geographies consisting of 200,899,042 people shows a slight positive correlation between the proportion of Immigrants from Middle Africa and poverty level among females between the ages 18 and 24 in the United States with a correlation coefficient (R) of 0.092 and weighted average of 22.1%. Similarly, the statistical analysis conducted on geographies consisting of 279,729,730 people shows a weak negative correlation between the proportion of Immigrants from Nigeria and poverty level among females between the ages 18 and 24 in the United States with a correlation coefficient (R) of -0.291 and weighted average of 20.1%, a difference of 10.1%.
Immigrants from Middle Africa vs Immigrants from Nigeria Female Poverty Among 18-24 Year Olds

Female Poverty Among 18-24 Year Olds Correlation Summary

MeasurementImmigrants from Middle AfricaImmigrants from Nigeria
Minimum1.6%5.1%
Maximum43.9%23.7%
Range42.3%18.6%
Mean22.1%16.6%
Median22.0%17.1%
Interquartile 25% (IQ1)16.2%13.5%
Interquartile 75% (IQ3)26.0%21.0%
Interquartile Range (IQR)9.8%7.5%
Standard Deviation (Sample)9.6%5.0%
Standard Deviation (Population)9.5%4.9%

Similar Demographics by Female Poverty Among 18-24 Year Olds

Demographics Similar to Immigrants from Middle Africa by Female Poverty Among 18-24 Year Olds

In terms of female poverty among 18-24 year olds, the demographic groups most similar to Immigrants from Middle Africa are Ugandan (22.1%, a difference of 0.010%), Ottawa (22.0%, a difference of 0.20%), Tlingit-Haida (22.0%, a difference of 0.32%), Subsaharan African (22.0%, a difference of 0.33%), and Bermudan (21.9%, a difference of 0.63%).
DemographicsRating | RankFemale Poverty Among 18-24 Year Olds
Immigrants | Dominica
0.1
/100
|
#280
Tragic
21.9%
Immigrants | Dominican Republic
0.1
/100
|
#281
Tragic
21.9%
Bermudans
0.1
/100
|
#282
Tragic
21.9%
Sub-Saharan Africans
0.0
/100
|
#283
Tragic
22.0%
Tlingit-Haida
0.0
/100
|
#284
Tragic
22.0%
Ottawa
0.0
/100
|
#285
Tragic
22.0%
Ugandans
0.0
/100
|
#286
Tragic
22.1%
Immigrants | Middle Africa
0.0
/100
|
#287
Tragic
22.1%
Dominicans
0.0
/100
|
#288
Tragic
22.3%
French American Indians
0.0
/100
|
#289
Tragic
22.3%
Immigrants | Senegal
0.0
/100
|
#290
Tragic
22.4%
Bangladeshis
0.0
/100
|
#291
Tragic
22.5%
Alaskan Athabascans
0.0
/100
|
#292
Tragic
22.5%
U.S. Virgin Islanders
0.0
/100
|
#293
Tragic
22.5%
Indonesians
0.0
/100
|
#294
Tragic
22.5%

Demographics Similar to Immigrants from Nigeria by Female Poverty Among 18-24 Year Olds

In terms of female poverty among 18-24 year olds, the demographic groups most similar to Immigrants from Nigeria are Iranian (20.1%, a difference of 0.020%), Hmong (20.0%, a difference of 0.060%), Belizean (20.1%, a difference of 0.11%), Irish (20.1%, a difference of 0.21%), and Swedish (20.1%, a difference of 0.21%).
DemographicsRating | RankFemale Poverty Among 18-24 Year Olds
Central Americans
70.0
/100
|
#164
Good
19.9%
Eastern Europeans
69.3
/100
|
#165
Good
19.9%
Belgians
69.1
/100
|
#166
Good
19.9%
Czechoslovakians
61.8
/100
|
#167
Good
20.0%
Fijians
59.1
/100
|
#168
Average
20.0%
Hmong
55.4
/100
|
#169
Average
20.0%
Iranians
54.7
/100
|
#170
Average
20.1%
Immigrants | Nigeria
54.3
/100
|
#171
Average
20.1%
Belizeans
52.0
/100
|
#172
Average
20.1%
Irish
50.0
/100
|
#173
Average
20.1%
Swedes
50.0
/100
|
#174
Average
20.1%
South American Indians
48.4
/100
|
#175
Average
20.1%
Kenyans
44.9
/100
|
#176
Average
20.2%
Immigrants | Kazakhstan
44.2
/100
|
#177
Average
20.2%
Swiss
44.0
/100
|
#178
Average
20.2%