Cajun vs Immigrants from Nigeria Nursery School
COMPARE
Cajun
Immigrants from Nigeria
Nursery School
Nursery School Comparison
Cajuns
Immigrants from Nigeria
98.4%
NURSERY SCHOOL
99.4/ 100
METRIC RATING
73rd/ 347
METRIC RANK
97.5%
NURSERY SCHOOL
0.3/ 100
METRIC RATING
267th/ 347
METRIC RANK
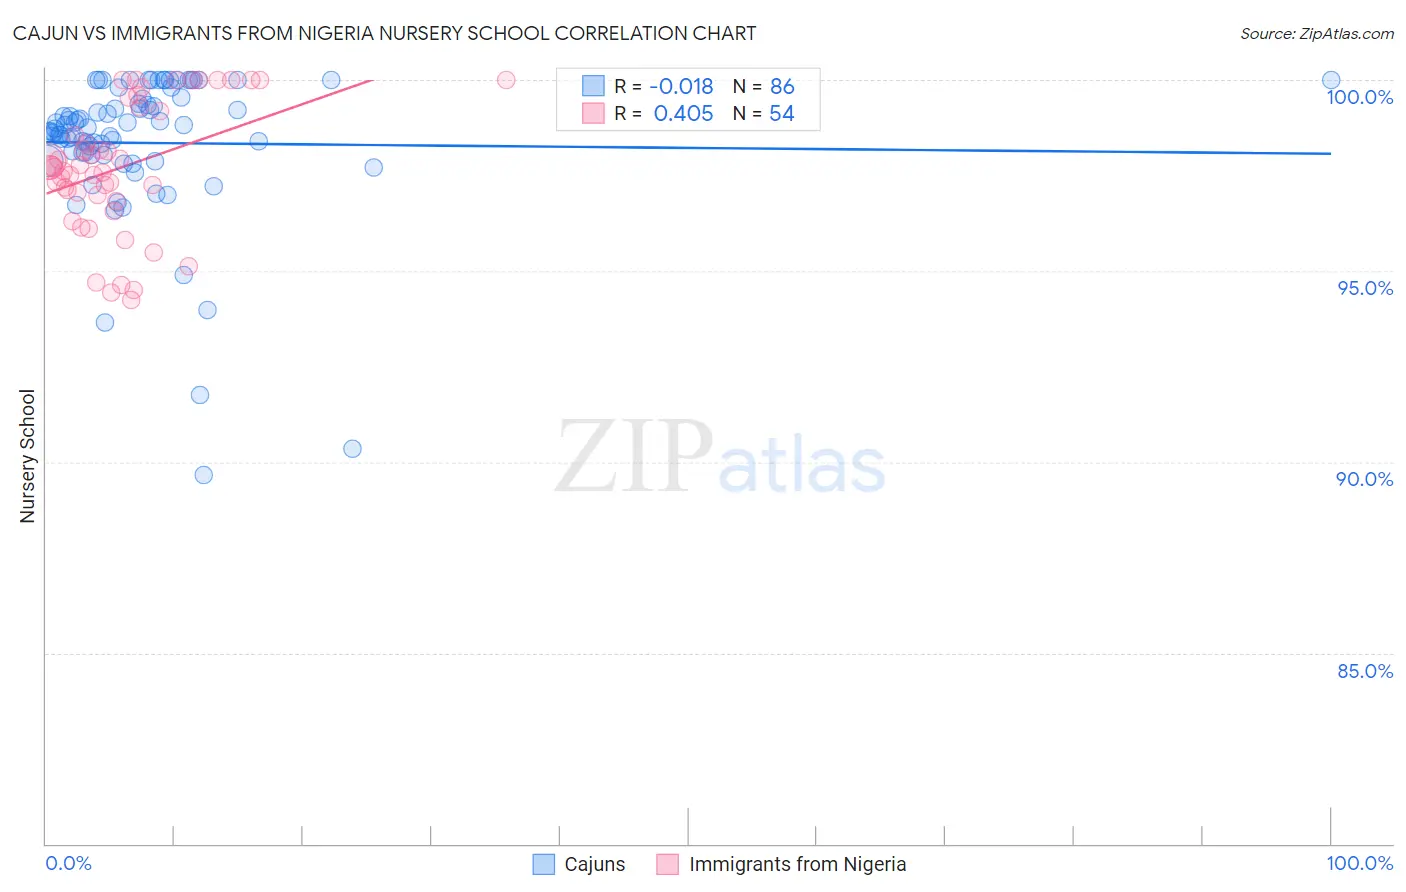
Cajun vs Immigrants from Nigeria Nursery School Correlation Chart
The statistical analysis conducted on geographies consisting of 149,712,957 people shows no correlation between the proportion of Cajuns and percentage of population with at least nursery school education in the United States with a correlation coefficient (R) of -0.018 and weighted average of 98.4%. Similarly, the statistical analysis conducted on geographies consisting of 283,430,369 people shows a moderate positive correlation between the proportion of Immigrants from Nigeria and percentage of population with at least nursery school education in the United States with a correlation coefficient (R) of 0.405 and weighted average of 97.5%, a difference of 0.83%.
Nursery School Correlation Summary
| Measurement | Cajun | Immigrants from Nigeria |
| Minimum | 89.7% | 94.2% |
| Maximum | 100.0% | 100.0% |
| Range | 10.3% | 5.8% |
| Mean | 98.4% | 97.7% |
| Median | 98.7% | 97.7% |
| Interquartile 25% (IQ1) | 98.1% | 97.0% |
| Interquartile 75% (IQ3) | 99.5% | 99.3% |
| Interquartile Range (IQR) | 1.5% | 2.3% |
| Standard Deviation (Sample) | 1.9% | 1.7% |
| Standard Deviation (Population) | 1.9% | 1.7% |
Similar Demographics by Nursery School
Demographics Similar to Cajuns by Nursery School
In terms of nursery school, the demographic groups most similar to Cajuns are Immigrants from Netherlands (98.4%, a difference of 0.0%), Cherokee (98.3%, a difference of 0.010%), Immigrants from England (98.3%, a difference of 0.010%), Immigrants from Lithuania (98.3%, a difference of 0.010%), and Delaware (98.3%, a difference of 0.010%).
| Demographics | Rating | Rank | Nursery School |
| Canadians | 99.7 /100 | #66 | Exceptional 98.4% |
| Immigrants | Northern Europe | 99.6 /100 | #67 | Exceptional 98.4% |
| Russians | 99.6 /100 | #68 | Exceptional 98.4% |
| Immigrants | Austria | 99.6 /100 | #69 | Exceptional 98.4% |
| Cheyenne | 99.6 /100 | #70 | Exceptional 98.4% |
| Serbians | 99.6 /100 | #71 | Exceptional 98.4% |
| Chickasaw | 99.6 /100 | #72 | Exceptional 98.4% |
| Cajuns | 99.4 /100 | #73 | Exceptional 98.4% |
| Immigrants | Netherlands | 99.4 /100 | #74 | Exceptional 98.4% |
| Cherokee | 99.3 /100 | #75 | Exceptional 98.3% |
| Immigrants | England | 99.3 /100 | #76 | Exceptional 98.3% |
| Immigrants | Lithuania | 99.3 /100 | #77 | Exceptional 98.3% |
| Delaware | 99.3 /100 | #78 | Exceptional 98.3% |
| Immigrants | Belgium | 99.3 /100 | #79 | Exceptional 98.3% |
| Shoshone | 99.3 /100 | #80 | Exceptional 98.3% |
Demographics Similar to Immigrants from Nigeria by Nursery School
In terms of nursery school, the demographic groups most similar to Immigrants from Nigeria are West Indian (97.5%, a difference of 0.0%), Immigrants from Liberia (97.5%, a difference of 0.0%), Assyrian/Chaldean/Syriac (97.6%, a difference of 0.010%), Immigrants from Sierra Leone (97.6%, a difference of 0.010%), and Immigrants from Ethiopia (97.6%, a difference of 0.020%).
| Demographics | Rating | Rank | Nursery School |
| Immigrants | South America | 0.4 /100 | #260 | Tragic 97.6% |
| Cubans | 0.4 /100 | #261 | Tragic 97.6% |
| Immigrants | Ethiopia | 0.4 /100 | #262 | Tragic 97.6% |
| Fijians | 0.3 /100 | #263 | Tragic 97.6% |
| Taiwanese | 0.3 /100 | #264 | Tragic 97.6% |
| Assyrians/Chaldeans/Syriacs | 0.3 /100 | #265 | Tragic 97.6% |
| Immigrants | Sierra Leone | 0.3 /100 | #266 | Tragic 97.6% |
| Immigrants | Nigeria | 0.3 /100 | #267 | Tragic 97.5% |
| West Indians | 0.3 /100 | #268 | Tragic 97.5% |
| Immigrants | Liberia | 0.3 /100 | #269 | Tragic 97.5% |
| Immigrants | Jamaica | 0.2 /100 | #270 | Tragic 97.5% |
| Immigrants | Peru | 0.2 /100 | #271 | Tragic 97.5% |
| Immigrants | Bolivia | 0.1 /100 | #272 | Tragic 97.5% |
| Immigrants | China | 0.1 /100 | #273 | Tragic 97.5% |
| Immigrants | Cameroon | 0.1 /100 | #274 | Tragic 97.5% |