Immigrants from Middle Africa vs Seminole 6th Grade
COMPARE
Immigrants from Middle Africa
Seminole
6th Grade
6th Grade Comparison
Immigrants from Middle Africa
Seminole
96.5%
6TH GRADE
0.8/ 100
METRIC RATING
250th/ 347
METRIC RANK
97.2%
6TH GRADE
84.8/ 100
METRIC RATING
141st/ 347
METRIC RANK
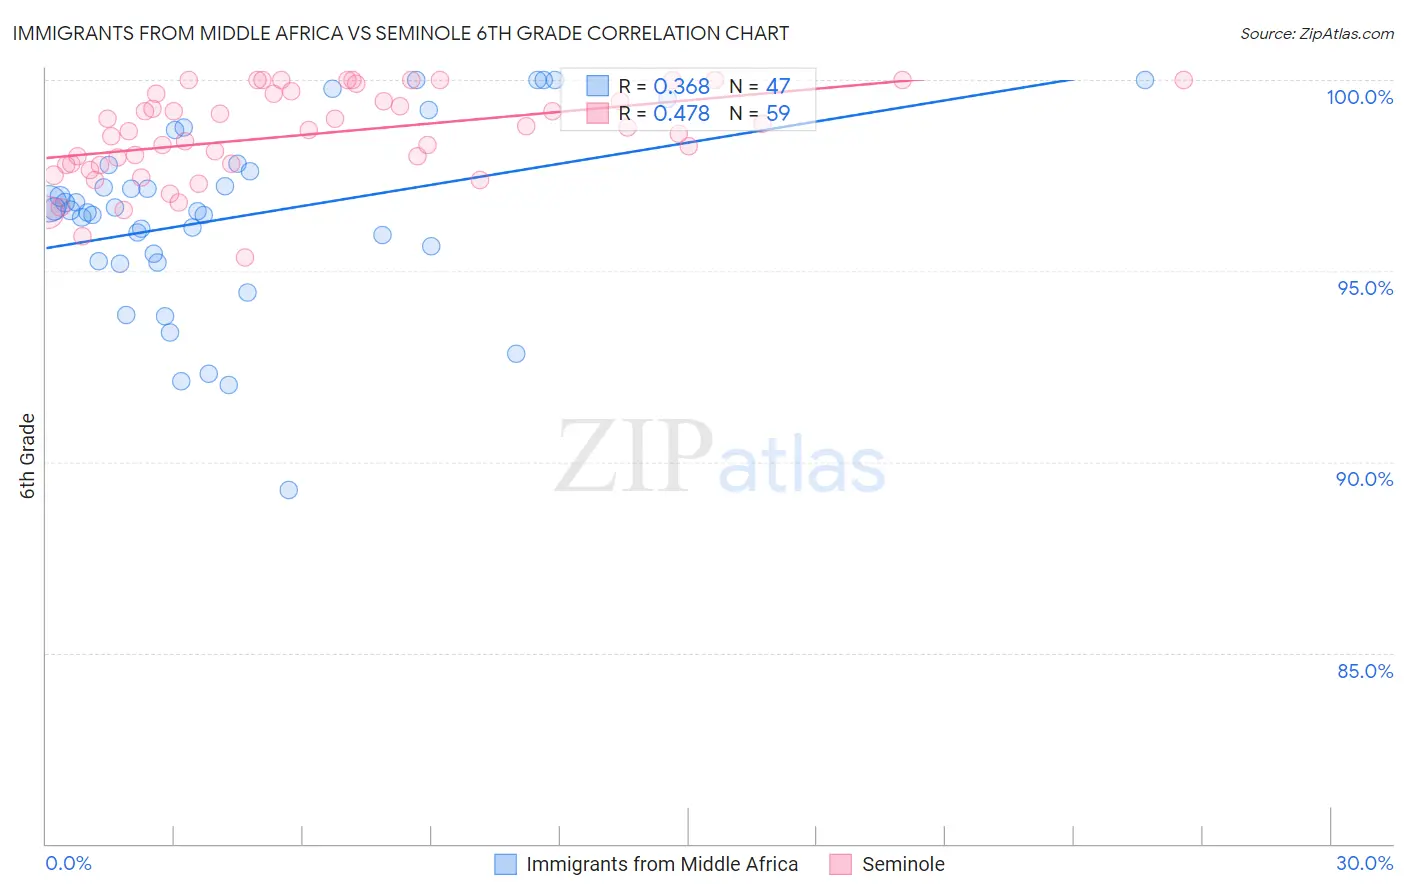
Immigrants from Middle Africa vs Seminole 6th Grade Correlation Chart
The statistical analysis conducted on geographies consisting of 202,721,852 people shows a mild positive correlation between the proportion of Immigrants from Middle Africa and percentage of population with at least 6th grade education in the United States with a correlation coefficient (R) of 0.368 and weighted average of 96.5%. Similarly, the statistical analysis conducted on geographies consisting of 118,313,204 people shows a moderate positive correlation between the proportion of Seminole and percentage of population with at least 6th grade education in the United States with a correlation coefficient (R) of 0.478 and weighted average of 97.2%, a difference of 0.75%.
6th Grade Correlation Summary
| Measurement | Immigrants from Middle Africa | Seminole |
| Minimum | 89.2% | 95.3% |
| Maximum | 100.0% | 100.0% |
| Range | 10.8% | 4.7% |
| Mean | 96.4% | 98.6% |
| Median | 96.6% | 98.7% |
| Interquartile 25% (IQ1) | 95.3% | 97.8% |
| Interquartile 75% (IQ3) | 97.8% | 99.6% |
| Interquartile Range (IQR) | 2.5% | 1.9% |
| Standard Deviation (Sample) | 2.4% | 1.2% |
| Standard Deviation (Population) | 2.4% | 1.2% |
Similar Demographics by 6th Grade
Demographics Similar to Immigrants from Middle Africa by 6th Grade
In terms of 6th grade, the demographic groups most similar to Immigrants from Middle Africa are Tohono O'odham (96.5%, a difference of 0.020%), Colombian (96.5%, a difference of 0.020%), Immigrants from Senegal (96.5%, a difference of 0.020%), Immigrants from Uruguay (96.5%, a difference of 0.020%), and Bolivian (96.5%, a difference of 0.030%).
| Demographics | Rating | Rank | 6th Grade |
| Immigrants | Liberia | 1.6 /100 | #243 | Tragic 96.6% |
| Ethiopians | 1.5 /100 | #244 | Tragic 96.6% |
| Immigrants | Costa Rica | 1.3 /100 | #245 | Tragic 96.6% |
| Immigrants | Africa | 1.3 /100 | #246 | Tragic 96.6% |
| Bolivians | 1.0 /100 | #247 | Tragic 96.5% |
| Tohono O'odham | 1.0 /100 | #248 | Tragic 96.5% |
| Colombians | 0.9 /100 | #249 | Tragic 96.5% |
| Immigrants | Middle Africa | 0.8 /100 | #250 | Tragic 96.5% |
| Immigrants | Senegal | 0.7 /100 | #251 | Tragic 96.5% |
| Immigrants | Uruguay | 0.6 /100 | #252 | Tragic 96.5% |
| Jamaicans | 0.6 /100 | #253 | Tragic 96.5% |
| Immigrants | Ethiopia | 0.6 /100 | #254 | Tragic 96.5% |
| Immigrants | Congo | 0.6 /100 | #255 | Tragic 96.5% |
| U.S. Virgin Islanders | 0.5 /100 | #256 | Tragic 96.5% |
| Taiwanese | 0.5 /100 | #257 | Tragic 96.5% |
Demographics Similar to Seminole by 6th Grade
In terms of 6th grade, the demographic groups most similar to Seminole are Jordanian (97.2%, a difference of 0.0%), Immigrants from Turkey (97.3%, a difference of 0.010%), Immigrants from North Macedonia (97.2%, a difference of 0.010%), Pima (97.2%, a difference of 0.020%), and Israeli (97.2%, a difference of 0.020%).
| Demographics | Rating | Rank | 6th Grade |
| Immigrants | Kuwait | 89.5 /100 | #134 | Excellent 97.3% |
| Immigrants | Hungary | 89.5 /100 | #135 | Excellent 97.3% |
| Filipinos | 88.9 /100 | #136 | Excellent 97.3% |
| Burmese | 87.8 /100 | #137 | Excellent 97.3% |
| Blackfeet | 87.7 /100 | #138 | Excellent 97.3% |
| Immigrants | Turkey | 86.1 /100 | #139 | Excellent 97.3% |
| Immigrants | North Macedonia | 85.5 /100 | #140 | Excellent 97.2% |
| Seminole | 84.8 /100 | #141 | Excellent 97.2% |
| Jordanians | 84.6 /100 | #142 | Excellent 97.2% |
| Pima | 82.9 /100 | #143 | Excellent 97.2% |
| Israelis | 82.9 /100 | #144 | Excellent 97.2% |
| Spaniards | 80.1 /100 | #145 | Excellent 97.2% |
| Hopi | 78.8 /100 | #146 | Good 97.2% |
| Immigrants | South Central Asia | 78.1 /100 | #147 | Good 97.2% |
| Immigrants | Greece | 77.8 /100 | #148 | Good 97.2% |