Immigrants from Middle Africa vs Uruguayan 3rd Grade
COMPARE
Immigrants from Middle Africa
Uruguayan
3rd Grade
3rd Grade Comparison
Immigrants from Middle Africa
Uruguayans
97.4%
3RD GRADE
0.9/ 100
METRIC RATING
250th/ 347
METRIC RANK
97.5%
3RD GRADE
5.0/ 100
METRIC RATING
221st/ 347
METRIC RANK
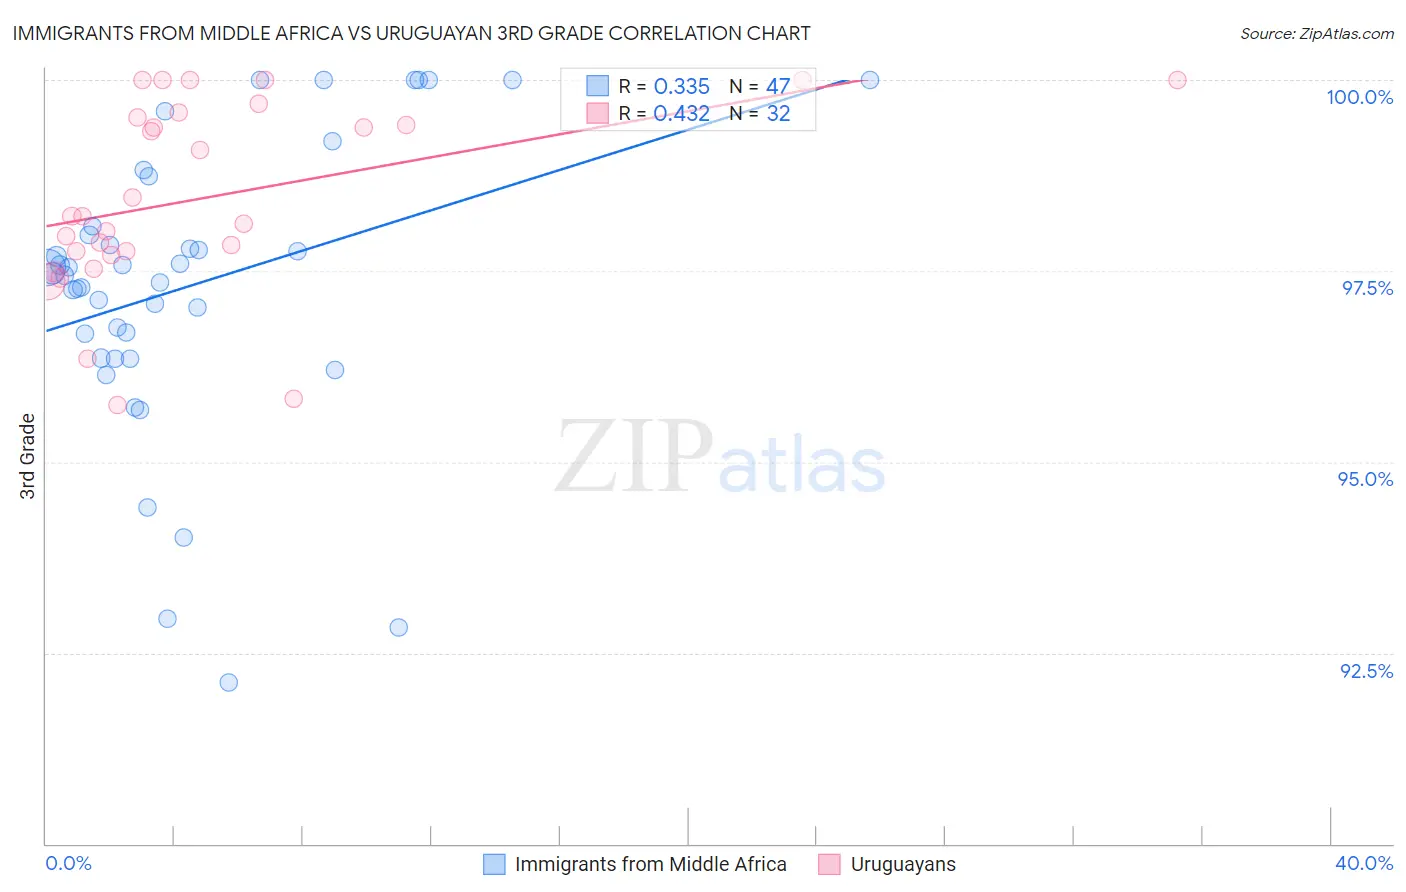
Immigrants from Middle Africa vs Uruguayan 3rd Grade Correlation Chart
The statistical analysis conducted on geographies consisting of 202,721,852 people shows a mild positive correlation between the proportion of Immigrants from Middle Africa and percentage of population with at least 3rd grade education in the United States with a correlation coefficient (R) of 0.335 and weighted average of 97.4%. Similarly, the statistical analysis conducted on geographies consisting of 144,782,794 people shows a moderate positive correlation between the proportion of Uruguayans and percentage of population with at least 3rd grade education in the United States with a correlation coefficient (R) of 0.432 and weighted average of 97.5%, a difference of 0.15%.
3rd Grade Correlation Summary
| Measurement | Immigrants from Middle Africa | Uruguayan |
| Minimum | 92.1% | 95.7% |
| Maximum | 100.0% | 100.0% |
| Range | 7.9% | 4.3% |
| Mean | 97.3% | 98.5% |
| Median | 97.5% | 98.2% |
| Interquartile 25% (IQ1) | 96.4% | 97.7% |
| Interquartile 75% (IQ3) | 98.1% | 99.5% |
| Interquartile Range (IQR) | 1.7% | 1.8% |
| Standard Deviation (Sample) | 1.9% | 1.2% |
| Standard Deviation (Population) | 1.9% | 1.2% |
Similar Demographics by 3rd Grade
Demographics Similar to Immigrants from Middle Africa by 3rd Grade
In terms of 3rd grade, the demographic groups most similar to Immigrants from Middle Africa are Immigrants from Asia (97.4%, a difference of 0.0%), Immigrants from Senegal (97.4%, a difference of 0.010%), Assyrian/Chaldean/Syriac (97.4%, a difference of 0.010%), Immigrants from Eastern Africa (97.4%, a difference of 0.010%), and South American (97.4%, a difference of 0.010%).
| Demographics | Rating | Rank | 3rd Grade |
| Indians (Asian) | 1.3 /100 | #243 | Tragic 97.4% |
| Asians | 1.1 /100 | #244 | Tragic 97.4% |
| Ethiopians | 1.1 /100 | #245 | Tragic 97.4% |
| Immigrants | Senegal | 1.0 /100 | #246 | Tragic 97.4% |
| Assyrians/Chaldeans/Syriacs | 1.0 /100 | #247 | Tragic 97.4% |
| Immigrants | Eastern Africa | 0.9 /100 | #248 | Tragic 97.4% |
| South Americans | 0.9 /100 | #249 | Tragic 97.4% |
| Immigrants | Middle Africa | 0.9 /100 | #250 | Tragic 97.4% |
| Immigrants | Asia | 0.8 /100 | #251 | Tragic 97.4% |
| Peruvians | 0.8 /100 | #252 | Tragic 97.4% |
| Immigrants | Africa | 0.8 /100 | #253 | Tragic 97.4% |
| Jamaicans | 0.7 /100 | #254 | Tragic 97.4% |
| Bolivians | 0.6 /100 | #255 | Tragic 97.3% |
| Immigrants | Congo | 0.6 /100 | #256 | Tragic 97.3% |
| Immigrants | Colombia | 0.5 /100 | #257 | Tragic 97.3% |
Demographics Similar to Uruguayans by 3rd Grade
In terms of 3rd grade, the demographic groups most similar to Uruguayans are Immigrants from Panama (97.5%, a difference of 0.0%), Immigrants from Morocco (97.5%, a difference of 0.0%), South American Indian (97.5%, a difference of 0.010%), Immigrants from Nepal (97.5%, a difference of 0.010%), and Sierra Leonean (97.5%, a difference of 0.010%).
| Demographics | Rating | Rank | 3rd Grade |
| Yuman | 8.4 /100 | #214 | Tragic 97.6% |
| Iraqis | 6.9 /100 | #215 | Tragic 97.5% |
| Samoans | 6.9 /100 | #216 | Tragic 97.5% |
| South American Indians | 5.7 /100 | #217 | Tragic 97.5% |
| Immigrants | Nepal | 5.3 /100 | #218 | Tragic 97.5% |
| Immigrants | Panama | 5.2 /100 | #219 | Tragic 97.5% |
| Immigrants | Morocco | 5.0 /100 | #220 | Tragic 97.5% |
| Uruguayans | 5.0 /100 | #221 | Tragic 97.5% |
| Sierra Leoneans | 4.6 /100 | #222 | Tragic 97.5% |
| Immigrants | Syria | 4.4 /100 | #223 | Tragic 97.5% |
| Bahamians | 4.4 /100 | #224 | Tragic 97.5% |
| Tongans | 4.3 /100 | #225 | Tragic 97.5% |
| Sudanese | 4.1 /100 | #226 | Tragic 97.5% |
| Immigrants | Sudan | 3.4 /100 | #227 | Tragic 97.5% |
| Sub-Saharan Africans | 3.2 /100 | #228 | Tragic 97.5% |