Immigrants from Middle Africa vs Greek Child Poverty Among Boys Under 16
COMPARE
Immigrants from Middle Africa
Greek
Child Poverty Among Boys Under 16
Child Poverty Among Boys Under 16 Comparison
Immigrants from Middle Africa
Greeks
18.9%
CHILD POVERTY AMONG BOYS UNDER 16
0.4/ 100
METRIC RATING
244th/ 347
METRIC RANK
14.1%
CHILD POVERTY AMONG BOYS UNDER 16
99.4/ 100
METRIC RATING
46th/ 347
METRIC RANK
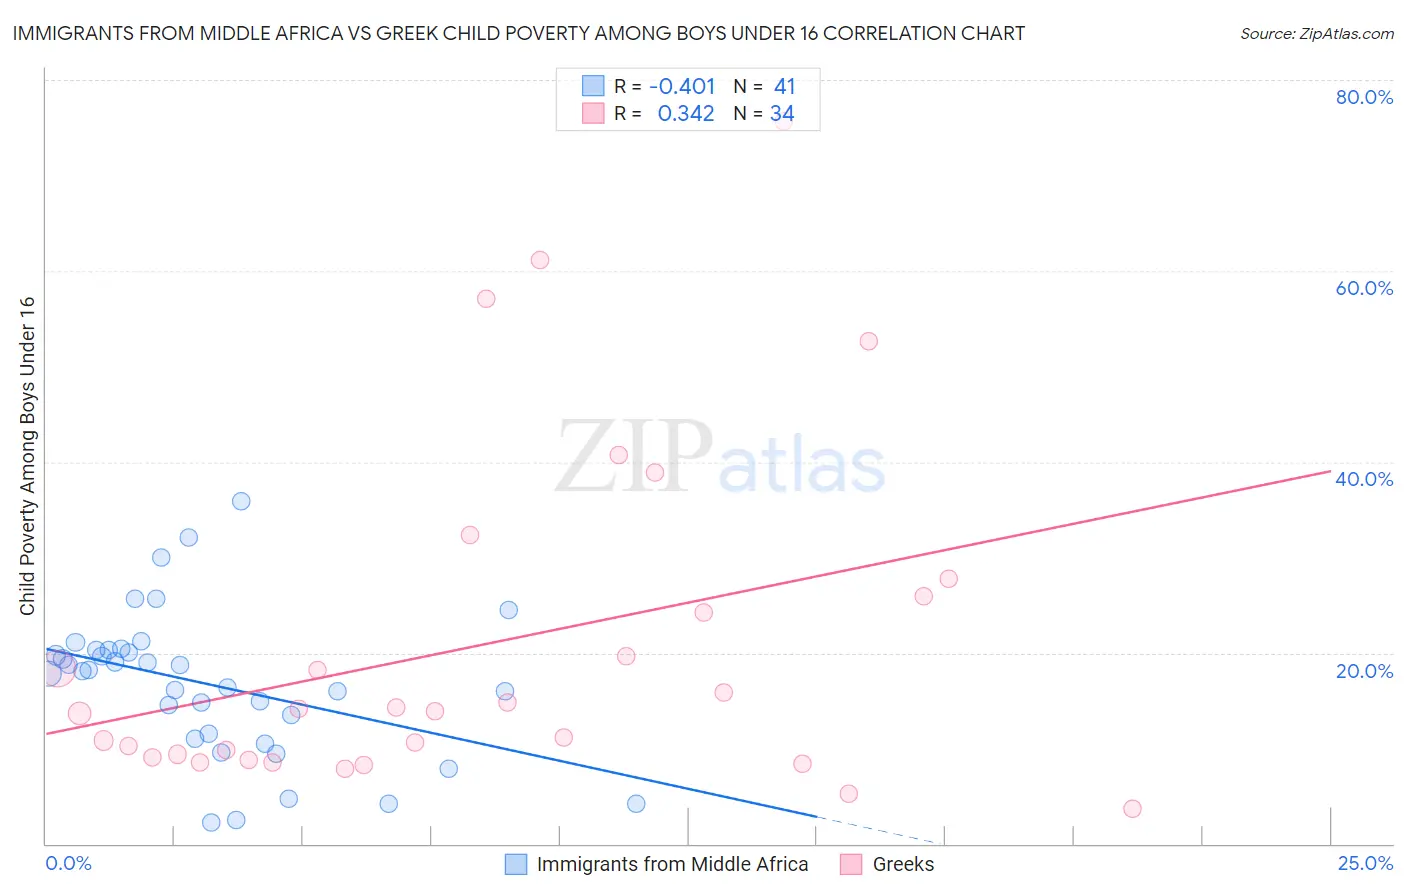
Immigrants from Middle Africa vs Greek Child Poverty Among Boys Under 16 Correlation Chart
The statistical analysis conducted on geographies consisting of 201,664,173 people shows a moderate negative correlation between the proportion of Immigrants from Middle Africa and poverty level among boys under the age of 16 in the United States with a correlation coefficient (R) of -0.401 and weighted average of 18.9%. Similarly, the statistical analysis conducted on geographies consisting of 470,038,788 people shows a mild positive correlation between the proportion of Greeks and poverty level among boys under the age of 16 in the United States with a correlation coefficient (R) of 0.342 and weighted average of 14.1%, a difference of 34.5%.
Child Poverty Among Boys Under 16 Correlation Summary
| Measurement | Immigrants from Middle Africa | Greek |
| Minimum | 2.2% | 3.7% |
| Maximum | 35.8% | 75.7% |
| Range | 33.6% | 72.0% |
| Mean | 16.7% | 20.9% |
| Median | 18.0% | 14.0% |
| Interquartile 25% (IQ1) | 11.3% | 9.0% |
| Interquartile 75% (IQ3) | 20.3% | 26.0% |
| Interquartile Range (IQR) | 9.0% | 16.9% |
| Standard Deviation (Sample) | 7.6% | 17.8% |
| Standard Deviation (Population) | 7.5% | 17.5% |
Similar Demographics by Child Poverty Among Boys Under 16
Demographics Similar to Immigrants from Middle Africa by Child Poverty Among Boys Under 16
In terms of child poverty among boys under 16, the demographic groups most similar to Immigrants from Middle Africa are Immigrants from the Azores (18.9%, a difference of 0.010%), Cree (19.0%, a difference of 0.13%), Immigrants from Nicaragua (19.0%, a difference of 0.33%), Ghanaian (18.9%, a difference of 0.35%), and Immigrants from Trinidad and Tobago (19.0%, a difference of 0.45%).
| Demographics | Rating | Rank | Child Poverty Among Boys Under 16 |
| Immigrants | Eritrea | 0.8 /100 | #237 | Tragic 18.6% |
| Immigrants | Laos | 0.8 /100 | #238 | Tragic 18.7% |
| Cape Verdeans | 0.7 /100 | #239 | Tragic 18.7% |
| Immigrants | Cuba | 0.6 /100 | #240 | Tragic 18.8% |
| Immigrants | Sudan | 0.6 /100 | #241 | Tragic 18.8% |
| Ghanaians | 0.5 /100 | #242 | Tragic 18.9% |
| Immigrants | Azores | 0.4 /100 | #243 | Tragic 18.9% |
| Immigrants | Middle Africa | 0.4 /100 | #244 | Tragic 18.9% |
| Cree | 0.4 /100 | #245 | Tragic 19.0% |
| Immigrants | Nicaragua | 0.4 /100 | #246 | Tragic 19.0% |
| Immigrants | Trinidad and Tobago | 0.3 /100 | #247 | Tragic 19.0% |
| Salvadorans | 0.3 /100 | #248 | Tragic 19.0% |
| Alsatians | 0.3 /100 | #249 | Tragic 19.1% |
| Immigrants | Burma/Myanmar | 0.2 /100 | #250 | Tragic 19.2% |
| French American Indians | 0.2 /100 | #251 | Tragic 19.2% |
Demographics Similar to Greeks by Child Poverty Among Boys Under 16
In terms of child poverty among boys under 16, the demographic groups most similar to Greeks are Immigrants from Scotland (14.1%, a difference of 0.10%), Estonian (14.1%, a difference of 0.20%), Immigrants from Moldova (14.1%, a difference of 0.27%), Immigrants from Indonesia (14.1%, a difference of 0.29%), and Czech (14.1%, a difference of 0.38%).
| Demographics | Rating | Rank | Child Poverty Among Boys Under 16 |
| Immigrants | Australia | 99.6 /100 | #39 | Exceptional 13.9% |
| Immigrants | Asia | 99.6 /100 | #40 | Exceptional 13.9% |
| Lithuanians | 99.6 /100 | #41 | Exceptional 14.0% |
| Koreans | 99.6 /100 | #42 | Exceptional 14.0% |
| Croatians | 99.5 /100 | #43 | Exceptional 14.0% |
| Estonians | 99.4 /100 | #44 | Exceptional 14.1% |
| Immigrants | Scotland | 99.4 /100 | #45 | Exceptional 14.1% |
| Greeks | 99.4 /100 | #46 | Exceptional 14.1% |
| Immigrants | Moldova | 99.4 /100 | #47 | Exceptional 14.1% |
| Immigrants | Indonesia | 99.4 /100 | #48 | Exceptional 14.1% |
| Czechs | 99.3 /100 | #49 | Exceptional 14.1% |
| Italians | 99.2 /100 | #50 | Exceptional 14.2% |
| Immigrants | Greece | 99.2 /100 | #51 | Exceptional 14.2% |
| Laotians | 99.0 /100 | #52 | Exceptional 14.3% |
| Immigrants | Philippines | 99.0 /100 | #53 | Exceptional 14.3% |