Immigrants from Micronesia vs Uruguayan Unemployment Among Seniors over 65 years
COMPARE
Immigrants from Micronesia
Uruguayan
Unemployment Among Seniors over 65 years
Unemployment Among Seniors over 65 years Comparison
Immigrants from Micronesia
Uruguayans
5.4%
UNEMPLOYMENT AMONG SENIORS OVER 65 YEARS
0.4/ 100
METRIC RATING
257th/ 347
METRIC RANK
5.2%
UNEMPLOYMENT AMONG SENIORS OVER 65 YEARS
12.6/ 100
METRIC RATING
208th/ 347
METRIC RANK
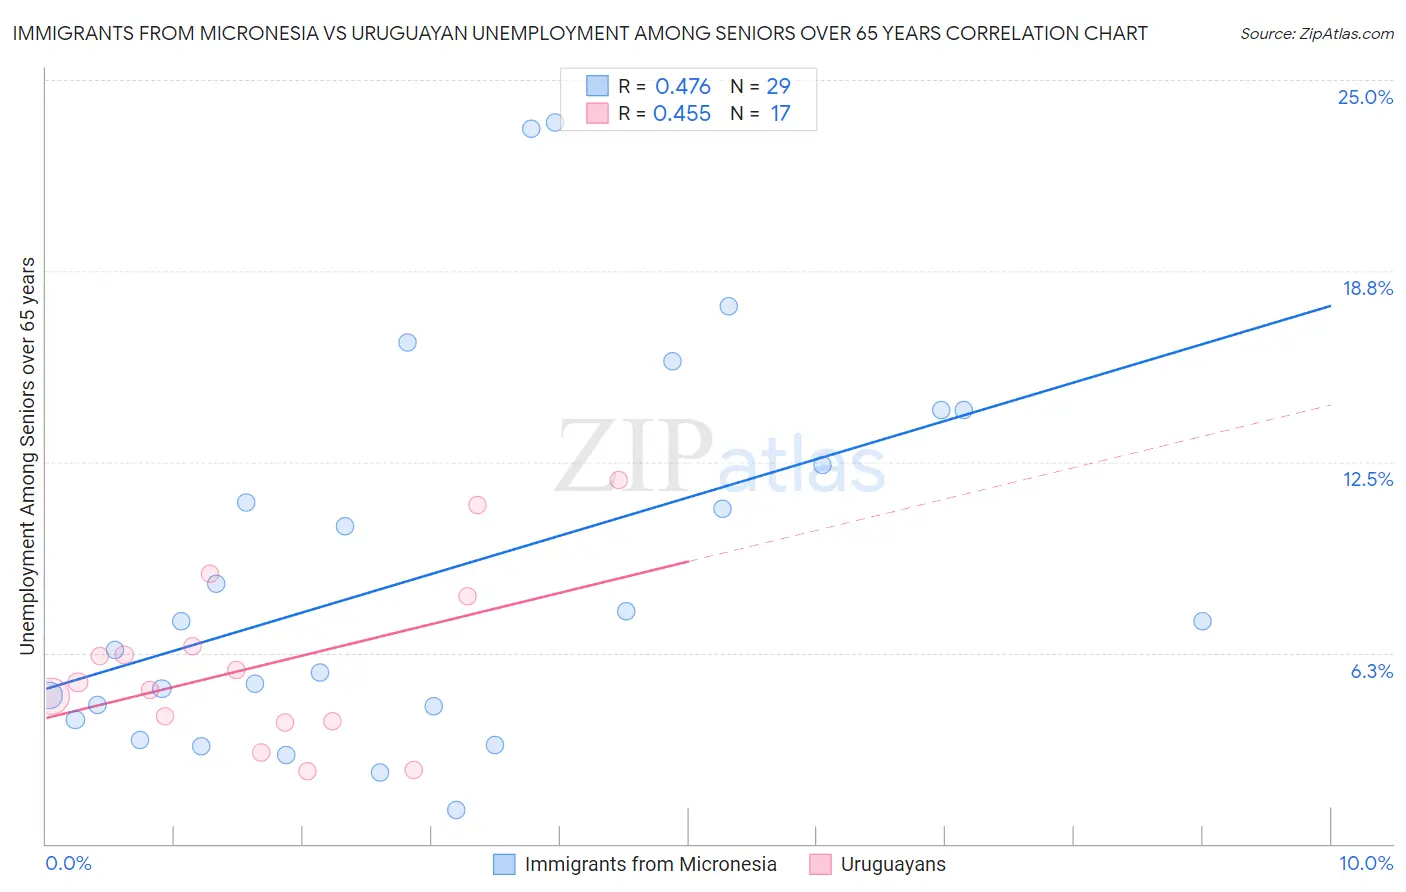
Immigrants from Micronesia vs Uruguayan Unemployment Among Seniors over 65 years Correlation Chart
The statistical analysis conducted on geographies consisting of 58,652,475 people shows a moderate positive correlation between the proportion of Immigrants from Micronesia and unemployment rate amomg seniors over the age of 65 in the United States with a correlation coefficient (R) of 0.476 and weighted average of 5.4%. Similarly, the statistical analysis conducted on geographies consisting of 139,566,940 people shows a moderate positive correlation between the proportion of Uruguayans and unemployment rate amomg seniors over the age of 65 in the United States with a correlation coefficient (R) of 0.455 and weighted average of 5.2%, a difference of 2.8%.
Unemployment Among Seniors over 65 years Correlation Summary
| Measurement | Immigrants from Micronesia | Uruguayan |
| Minimum | 1.1% | 2.4% |
| Maximum | 23.6% | 11.9% |
| Range | 22.5% | 9.5% |
| Mean | 8.9% | 5.8% |
| Median | 7.3% | 5.3% |
| Interquartile 25% (IQ1) | 4.3% | 4.0% |
| Interquartile 75% (IQ3) | 13.3% | 7.3% |
| Interquartile Range (IQR) | 9.0% | 3.3% |
| Standard Deviation (Sample) | 6.1% | 2.8% |
| Standard Deviation (Population) | 6.0% | 2.7% |
Similar Demographics by Unemployment Among Seniors over 65 years
Demographics Similar to Immigrants from Micronesia by Unemployment Among Seniors over 65 years
In terms of unemployment among seniors over 65 years, the demographic groups most similar to Immigrants from Micronesia are Sierra Leonean (5.4%, a difference of 0.070%), Moroccan (5.4%, a difference of 0.090%), Paraguayan (5.4%, a difference of 0.12%), Immigrants from Peru (5.4%, a difference of 0.12%), and Immigrants from Ghana (5.4%, a difference of 0.15%).
| Demographics | Rating | Rank | Unemployment Among Seniors over 65 years |
| Ghanaians | 0.6 /100 | #250 | Tragic 5.4% |
| West Indians | 0.6 /100 | #251 | Tragic 5.4% |
| Trinidadians and Tobagonians | 0.6 /100 | #252 | Tragic 5.4% |
| Immigrants | Sierra Leone | 0.6 /100 | #253 | Tragic 5.4% |
| Paraguayans | 0.5 /100 | #254 | Tragic 5.4% |
| Immigrants | Peru | 0.5 /100 | #255 | Tragic 5.4% |
| Moroccans | 0.5 /100 | #256 | Tragic 5.4% |
| Immigrants | Micronesia | 0.4 /100 | #257 | Tragic 5.4% |
| Sierra Leoneans | 0.4 /100 | #258 | Tragic 5.4% |
| Immigrants | Ghana | 0.4 /100 | #259 | Tragic 5.4% |
| Native Hawaiians | 0.3 /100 | #260 | Tragic 5.4% |
| Spanish American Indians | 0.2 /100 | #261 | Tragic 5.4% |
| Immigrants | Grenada | 0.2 /100 | #262 | Tragic 5.4% |
| South Americans | 0.2 /100 | #263 | Tragic 5.4% |
| Central American Indians | 0.2 /100 | #264 | Tragic 5.4% |
Demographics Similar to Uruguayans by Unemployment Among Seniors over 65 years
In terms of unemployment among seniors over 65 years, the demographic groups most similar to Uruguayans are Immigrants from Philippines (5.2%, a difference of 0.040%), Alsatian (5.2%, a difference of 0.090%), German Russian (5.2%, a difference of 0.14%), Immigrants from Uzbekistan (5.2%, a difference of 0.14%), and African (5.2%, a difference of 0.17%).
| Demographics | Rating | Rank | Unemployment Among Seniors over 65 years |
| Laotians | 18.1 /100 | #201 | Poor 5.2% |
| Immigrants | Northern Africa | 17.7 /100 | #202 | Poor 5.2% |
| Sub-Saharan Africans | 17.1 /100 | #203 | Poor 5.2% |
| Immigrants | China | 16.9 /100 | #204 | Poor 5.2% |
| South American Indians | 15.3 /100 | #205 | Poor 5.2% |
| German Russians | 14.7 /100 | #206 | Poor 5.2% |
| Immigrants | Philippines | 13.2 /100 | #207 | Poor 5.2% |
| Uruguayans | 12.6 /100 | #208 | Poor 5.2% |
| Alsatians | 11.4 /100 | #209 | Poor 5.2% |
| Immigrants | Uzbekistan | 10.7 /100 | #210 | Poor 5.2% |
| Africans | 10.4 /100 | #211 | Poor 5.2% |
| Immigrants | Honduras | 10.2 /100 | #212 | Poor 5.2% |
| Immigrants | Uruguay | 9.3 /100 | #213 | Tragic 5.2% |
| Albanians | 9.1 /100 | #214 | Tragic 5.2% |
| Immigrants | Fiji | 8.6 /100 | #215 | Tragic 5.2% |