Immigrants from Micronesia vs Immigrants from South America Kindergarten
COMPARE
Immigrants from Micronesia
Immigrants from South America
Kindergarten
Kindergarten Comparison
Immigrants from Micronesia
Immigrants from South America
98.0%
KINDERGARTEN
57.7/ 100
METRIC RATING
164th/ 347
METRIC RANK
97.5%
KINDERGARTEN
0.4/ 100
METRIC RATING
263rd/ 347
METRIC RANK
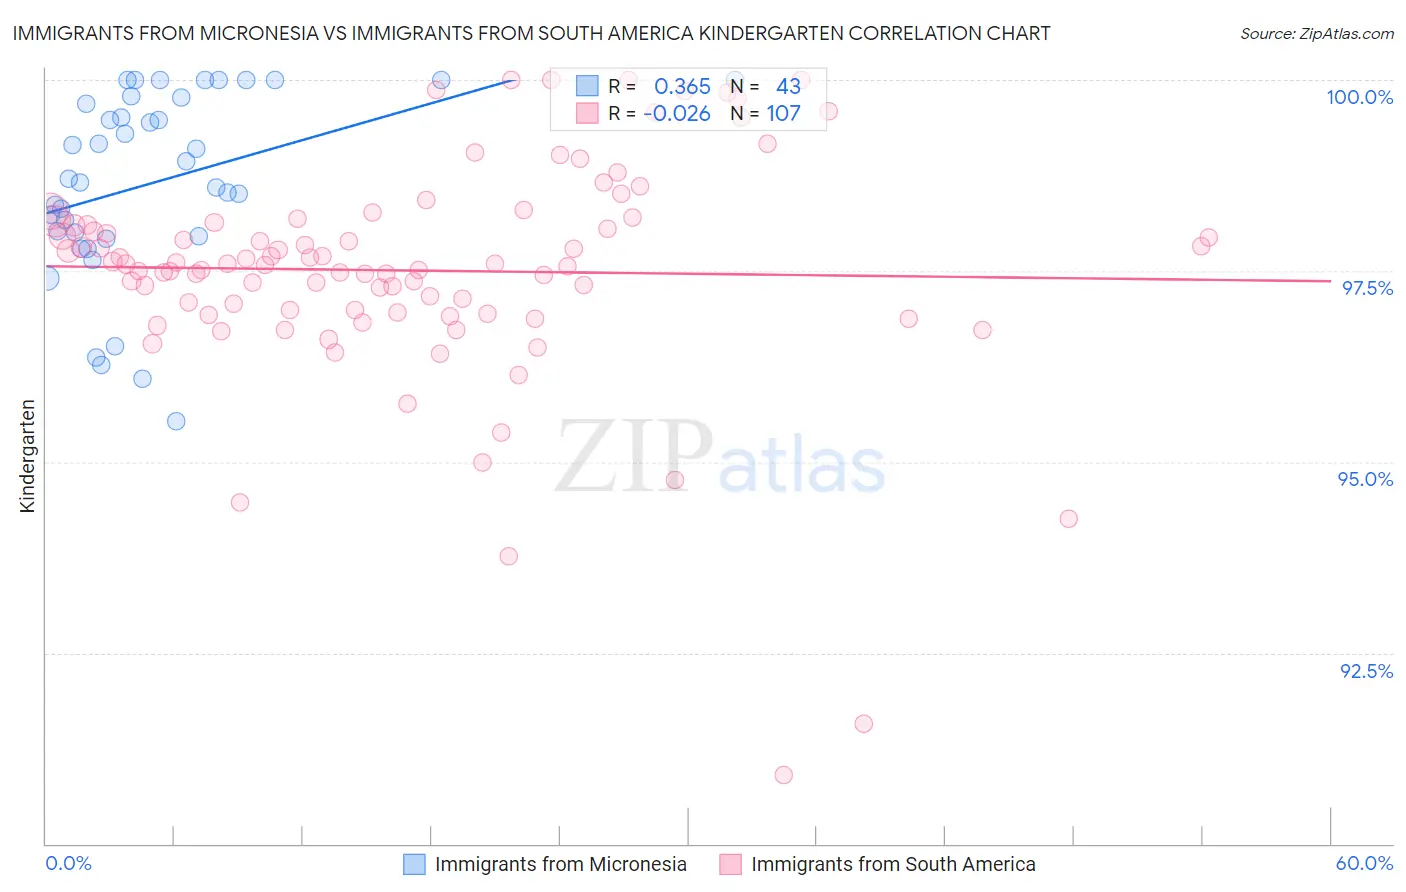
Immigrants from Micronesia vs Immigrants from South America Kindergarten Correlation Chart
The statistical analysis conducted on geographies consisting of 61,604,657 people shows a mild positive correlation between the proportion of Immigrants from Micronesia and percentage of population with at least kindergarten education in the United States with a correlation coefficient (R) of 0.365 and weighted average of 98.0%. Similarly, the statistical analysis conducted on geographies consisting of 486,429,719 people shows no correlation between the proportion of Immigrants from South America and percentage of population with at least kindergarten education in the United States with a correlation coefficient (R) of -0.026 and weighted average of 97.5%, a difference of 0.45%.
Kindergarten Correlation Summary
| Measurement | Immigrants from Micronesia | Immigrants from South America |
| Minimum | 95.5% | 90.9% |
| Maximum | 100.0% | 100.0% |
| Range | 4.5% | 9.1% |
| Mean | 98.7% | 97.5% |
| Median | 98.7% | 97.6% |
| Interquartile 25% (IQ1) | 98.0% | 97.0% |
| Interquartile 75% (IQ3) | 99.8% | 98.1% |
| Interquartile Range (IQR) | 1.8% | 1.2% |
| Standard Deviation (Sample) | 1.2% | 1.5% |
| Standard Deviation (Population) | 1.2% | 1.5% |
Similar Demographics by Kindergarten
Demographics Similar to Immigrants from Micronesia by Kindergarten
In terms of kindergarten, the demographic groups most similar to Immigrants from Micronesia are Immigrants from Russia (98.0%, a difference of 0.0%), Immigrants from Eastern Europe (98.0%, a difference of 0.0%), Immigrants from Italy (98.0%, a difference of 0.0%), Spanish American (98.0%, a difference of 0.0%), and Ugandan (98.0%, a difference of 0.0%).
| Demographics | Rating | Rank | Kindergarten |
| Immigrants | North Macedonia | 66.4 /100 | #157 | Good 98.0% |
| Venezuelans | 64.7 /100 | #158 | Good 98.0% |
| French American Indians | 63.7 /100 | #159 | Good 98.0% |
| Immigrants | Russia | 59.0 /100 | #160 | Average 98.0% |
| Immigrants | Eastern Europe | 59.0 /100 | #161 | Average 98.0% |
| Immigrants | Italy | 58.9 /100 | #162 | Average 98.0% |
| Spanish Americans | 57.8 /100 | #163 | Average 98.0% |
| Immigrants | Micronesia | 57.7 /100 | #164 | Average 98.0% |
| Ugandans | 56.9 /100 | #165 | Average 98.0% |
| Chileans | 56.3 /100 | #166 | Average 98.0% |
| Immigrants | Spain | 54.6 /100 | #167 | Average 98.0% |
| Navajo | 54.4 /100 | #168 | Average 98.0% |
| Immigrants | Korea | 54.1 /100 | #169 | Average 98.0% |
| Bermudans | 54.0 /100 | #170 | Average 98.0% |
| Immigrants | Jordan | 54.0 /100 | #171 | Average 98.0% |
Demographics Similar to Immigrants from South America by Kindergarten
In terms of kindergarten, the demographic groups most similar to Immigrants from South America are Taiwanese (97.5%, a difference of 0.0%), Immigrants from Ethiopia (97.5%, a difference of 0.0%), Assyrian/Chaldean/Syriac (97.5%, a difference of 0.0%), Armenian (97.6%, a difference of 0.010%), and Fijian (97.5%, a difference of 0.010%).
| Demographics | Rating | Rank | Kindergarten |
| Yaqui | 0.7 /100 | #256 | Tragic 97.6% |
| Immigrants | Colombia | 0.6 /100 | #257 | Tragic 97.6% |
| Jamaicans | 0.6 /100 | #258 | Tragic 97.6% |
| Armenians | 0.5 /100 | #259 | Tragic 97.6% |
| Fijians | 0.5 /100 | #260 | Tragic 97.5% |
| Taiwanese | 0.4 /100 | #261 | Tragic 97.5% |
| Immigrants | Ethiopia | 0.4 /100 | #262 | Tragic 97.5% |
| Immigrants | South America | 0.4 /100 | #263 | Tragic 97.5% |
| Assyrians/Chaldeans/Syriacs | 0.4 /100 | #264 | Tragic 97.5% |
| Cubans | 0.3 /100 | #265 | Tragic 97.5% |
| Immigrants | Sierra Leone | 0.3 /100 | #266 | Tragic 97.5% |
| Immigrants | Liberia | 0.3 /100 | #267 | Tragic 97.5% |
| Immigrants | Nigeria | 0.3 /100 | #268 | Tragic 97.5% |
| West Indians | 0.3 /100 | #269 | Tragic 97.5% |
| Immigrants | Jamaica | 0.2 /100 | #270 | Tragic 97.5% |