Immigrants from Micronesia vs Immigrants from Jamaica Associate's Degree
COMPARE
Immigrants from Micronesia
Immigrants from Jamaica
Associate's Degree
Associate's Degree Comparison
Immigrants from Micronesia
Immigrants from Jamaica
40.2%
ASSOCIATE'S DEGREE
0.1/ 100
METRIC RATING
280th/ 347
METRIC RANK
41.5%
ASSOCIATE'S DEGREE
0.3/ 100
METRIC RATING
263rd/ 347
METRIC RANK
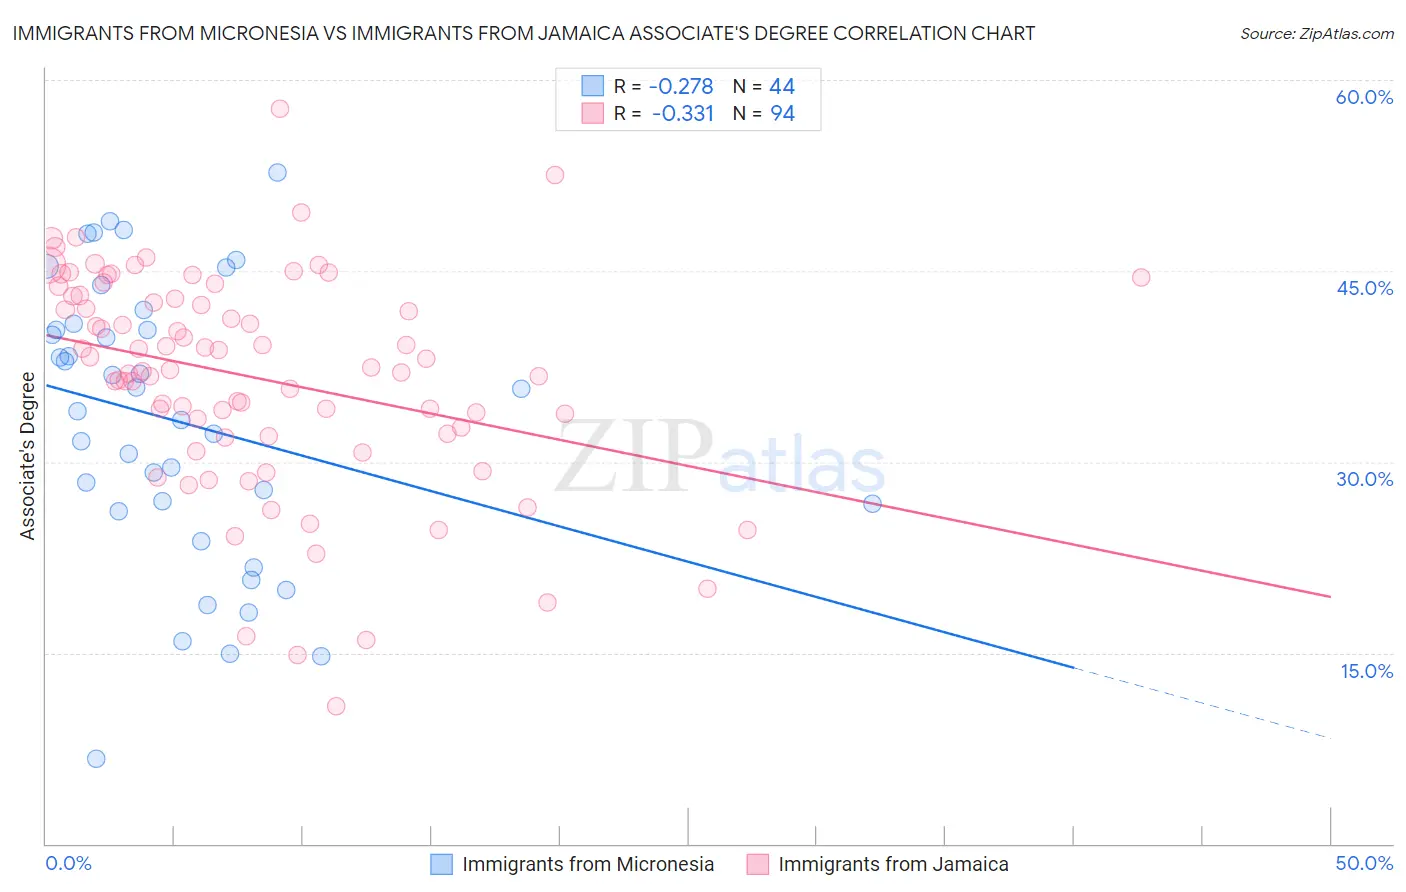
Immigrants from Micronesia vs Immigrants from Jamaica Associate's Degree Correlation Chart
The statistical analysis conducted on geographies consisting of 61,609,499 people shows a weak negative correlation between the proportion of Immigrants from Micronesia and percentage of population with at least associate's degree education in the United States with a correlation coefficient (R) of -0.278 and weighted average of 40.2%. Similarly, the statistical analysis conducted on geographies consisting of 301,813,943 people shows a mild negative correlation between the proportion of Immigrants from Jamaica and percentage of population with at least associate's degree education in the United States with a correlation coefficient (R) of -0.331 and weighted average of 41.5%, a difference of 3.2%.
Associate's Degree Correlation Summary
| Measurement | Immigrants from Micronesia | Immigrants from Jamaica |
| Minimum | 6.6% | 10.8% |
| Maximum | 52.7% | 57.7% |
| Range | 46.1% | 46.9% |
| Mean | 33.2% | 36.6% |
| Median | 34.9% | 37.3% |
| Interquartile 25% (IQ1) | 26.4% | 32.3% |
| Interquartile 75% (IQ3) | 40.6% | 43.1% |
| Interquartile Range (IQR) | 14.2% | 10.8% |
| Standard Deviation (Sample) | 11.0% | 8.6% |
| Standard Deviation (Population) | 10.9% | 8.6% |
Demographics Similar to Immigrants from Micronesia and Immigrants from Jamaica by Associate's Degree
In terms of associate's degree, the demographic groups most similar to Immigrants from Micronesia are Immigrants from Portugal (40.1%, a difference of 0.10%), Immigrants from Nicaragua (40.3%, a difference of 0.20%), Ottawa (40.3%, a difference of 0.24%), Blackfeet (40.3%, a difference of 0.39%), and Puerto Rican (40.4%, a difference of 0.44%). Similarly, the demographic groups most similar to Immigrants from Jamaica are Osage (41.5%, a difference of 0.010%), Bahamian (41.5%, a difference of 0.020%), Nicaraguan (41.5%, a difference of 0.11%), African (41.1%, a difference of 0.77%), and Samoan (41.1%, a difference of 0.77%).
| Demographics | Rating | Rank | Associate's Degree |
| Nicaraguans | 0.4 /100 | #261 | Tragic 41.5% |
| Bahamians | 0.4 /100 | #262 | Tragic 41.5% |
| Immigrants | Jamaica | 0.3 /100 | #263 | Tragic 41.5% |
| Osage | 0.3 /100 | #264 | Tragic 41.5% |
| Africans | 0.2 /100 | #265 | Tragic 41.1% |
| Samoans | 0.2 /100 | #266 | Tragic 41.1% |
| Hawaiians | 0.2 /100 | #267 | Tragic 40.9% |
| Central American Indians | 0.2 /100 | #268 | Tragic 40.8% |
| Americans | 0.2 /100 | #269 | Tragic 40.8% |
| Chippewa | 0.2 /100 | #270 | Tragic 40.7% |
| Immigrants | Laos | 0.1 /100 | #271 | Tragic 40.7% |
| Belizeans | 0.1 /100 | #272 | Tragic 40.6% |
| Puget Sound Salish | 0.1 /100 | #273 | Tragic 40.5% |
| Immigrants | Dominica | 0.1 /100 | #274 | Tragic 40.5% |
| Potawatomi | 0.1 /100 | #275 | Tragic 40.4% |
| Puerto Ricans | 0.1 /100 | #276 | Tragic 40.4% |
| Blackfeet | 0.1 /100 | #277 | Tragic 40.3% |
| Ottawa | 0.1 /100 | #278 | Tragic 40.3% |
| Immigrants | Nicaragua | 0.1 /100 | #279 | Tragic 40.3% |
| Immigrants | Micronesia | 0.1 /100 | #280 | Tragic 40.2% |
| Immigrants | Portugal | 0.1 /100 | #281 | Tragic 40.1% |