Immigrants from Micronesia vs Bolivian 1st Grade
COMPARE
Immigrants from Micronesia
Bolivian
1st Grade
1st Grade Comparison
Immigrants from Micronesia
Bolivians
97.9%
1ST GRADE
55.3/ 100
METRIC RATING
169th/ 347
METRIC RANK
97.6%
1ST GRADE
1.2/ 100
METRIC RATING
243rd/ 347
METRIC RANK
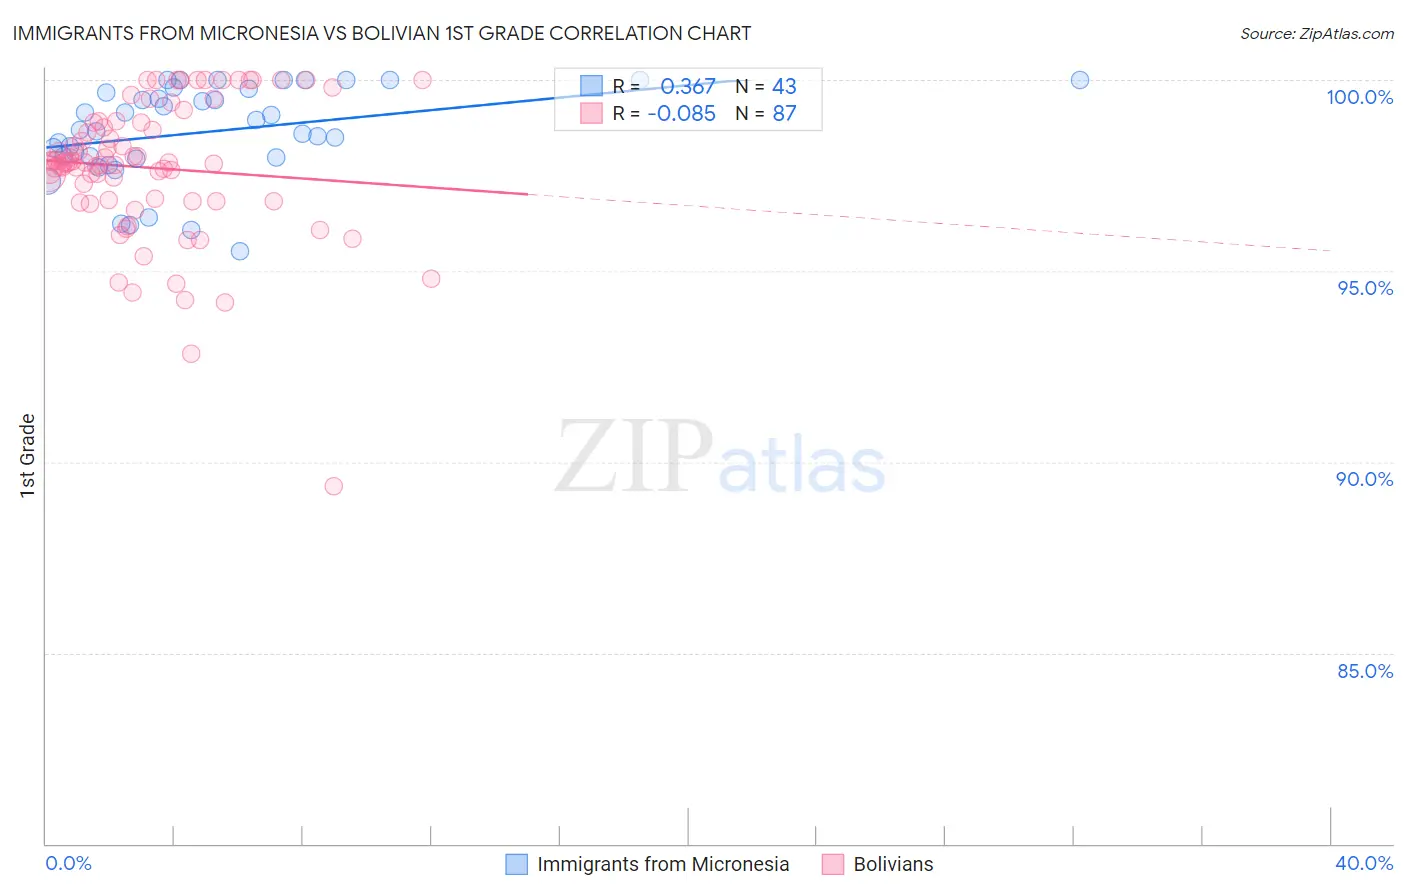
Immigrants from Micronesia vs Bolivian 1st Grade Correlation Chart
The statistical analysis conducted on geographies consisting of 61,604,657 people shows a mild positive correlation between the proportion of Immigrants from Micronesia and percentage of population with at least 1st grade education in the United States with a correlation coefficient (R) of 0.367 and weighted average of 97.9%. Similarly, the statistical analysis conducted on geographies consisting of 184,667,361 people shows a slight negative correlation between the proportion of Bolivians and percentage of population with at least 1st grade education in the United States with a correlation coefficient (R) of -0.085 and weighted average of 97.6%, a difference of 0.36%.
1st Grade Correlation Summary
| Measurement | Immigrants from Micronesia | Bolivian |
| Minimum | 95.5% | 89.3% |
| Maximum | 100.0% | 100.0% |
| Range | 4.5% | 10.7% |
| Mean | 98.6% | 97.7% |
| Median | 98.7% | 97.8% |
| Interquartile 25% (IQ1) | 98.0% | 96.8% |
| Interquartile 75% (IQ3) | 99.8% | 98.9% |
| Interquartile Range (IQR) | 1.8% | 2.0% |
| Standard Deviation (Sample) | 1.2% | 1.8% |
| Standard Deviation (Population) | 1.2% | 1.8% |
Similar Demographics by 1st Grade
Demographics Similar to Immigrants from Micronesia by 1st Grade
In terms of 1st grade, the demographic groups most similar to Immigrants from Micronesia are Ugandan (97.9%, a difference of 0.0%), Navajo (97.9%, a difference of 0.0%), Bermudan (97.9%, a difference of 0.0%), Chilean (97.9%, a difference of 0.0%), and Immigrants from Spain (97.9%, a difference of 0.0%).
| Demographics | Rating | Rank | 1st Grade |
| Immigrants | Eastern Europe | 58.9 /100 | #162 | Average 97.9% |
| Spanish Americans | 57.7 /100 | #163 | Average 97.9% |
| Brazilians | 57.6 /100 | #164 | Average 97.9% |
| Ugandans | 56.9 /100 | #165 | Average 97.9% |
| Navajo | 56.6 /100 | #166 | Average 97.9% |
| Bermudans | 56.3 /100 | #167 | Average 97.9% |
| Chileans | 55.6 /100 | #168 | Average 97.9% |
| Immigrants | Micronesia | 55.3 /100 | #169 | Average 97.9% |
| Immigrants | Spain | 54.9 /100 | #170 | Average 97.9% |
| Immigrants | Jordan | 53.9 /100 | #171 | Average 97.9% |
| Immigrants | Korea | 53.0 /100 | #172 | Average 97.9% |
| Kenyans | 51.2 /100 | #173 | Average 97.9% |
| Natives/Alaskans | 50.0 /100 | #174 | Average 97.9% |
| Immigrants | Sri Lanka | 49.7 /100 | #175 | Average 97.9% |
| Albanians | 49.6 /100 | #176 | Average 97.9% |
Demographics Similar to Bolivians by 1st Grade
In terms of 1st grade, the demographic groups most similar to Bolivians are Immigrants from Indonesia (97.6%, a difference of 0.0%), Liberian (97.6%, a difference of 0.010%), Asian (97.6%, a difference of 0.010%), South American (97.6%, a difference of 0.010%), and Immigrants from Eastern Africa (97.6%, a difference of 0.010%).
| Demographics | Rating | Rank | 1st Grade |
| Immigrants | Western Asia | 2.1 /100 | #236 | Tragic 97.6% |
| U.S. Virgin Islanders | 1.9 /100 | #237 | Tragic 97.6% |
| Nigerians | 1.8 /100 | #238 | Tragic 97.6% |
| Immigrants | Eastern Asia | 1.6 /100 | #239 | Tragic 97.6% |
| Koreans | 1.5 /100 | #240 | Tragic 97.6% |
| Liberians | 1.4 /100 | #241 | Tragic 97.6% |
| Immigrants | Indonesia | 1.2 /100 | #242 | Tragic 97.6% |
| Bolivians | 1.2 /100 | #243 | Tragic 97.6% |
| Asians | 1.1 /100 | #244 | Tragic 97.6% |
| South Americans | 1.1 /100 | #245 | Tragic 97.6% |
| Immigrants | Eastern Africa | 1.0 /100 | #246 | Tragic 97.6% |
| Peruvians | 1.0 /100 | #247 | Tragic 97.6% |
| Immigrants | Middle Africa | 1.0 /100 | #248 | Tragic 97.6% |
| Immigrants | Senegal | 1.0 /100 | #249 | Tragic 97.6% |
| Ethiopians | 0.9 /100 | #250 | Tragic 97.6% |