Immigrants from Micronesia vs Immigrants from Sri Lanka High School Diploma
COMPARE
Immigrants from Micronesia
Immigrants from Sri Lanka
High School Diploma
High School Diploma Comparison
Immigrants from Micronesia
Immigrants from Sri Lanka
88.6%
HIGH SCHOOL DIPLOMA
16.4/ 100
METRIC RATING
205th/ 347
METRIC RANK
90.2%
HIGH SCHOOL DIPLOMA
96.3/ 100
METRIC RATING
113th/ 347
METRIC RANK
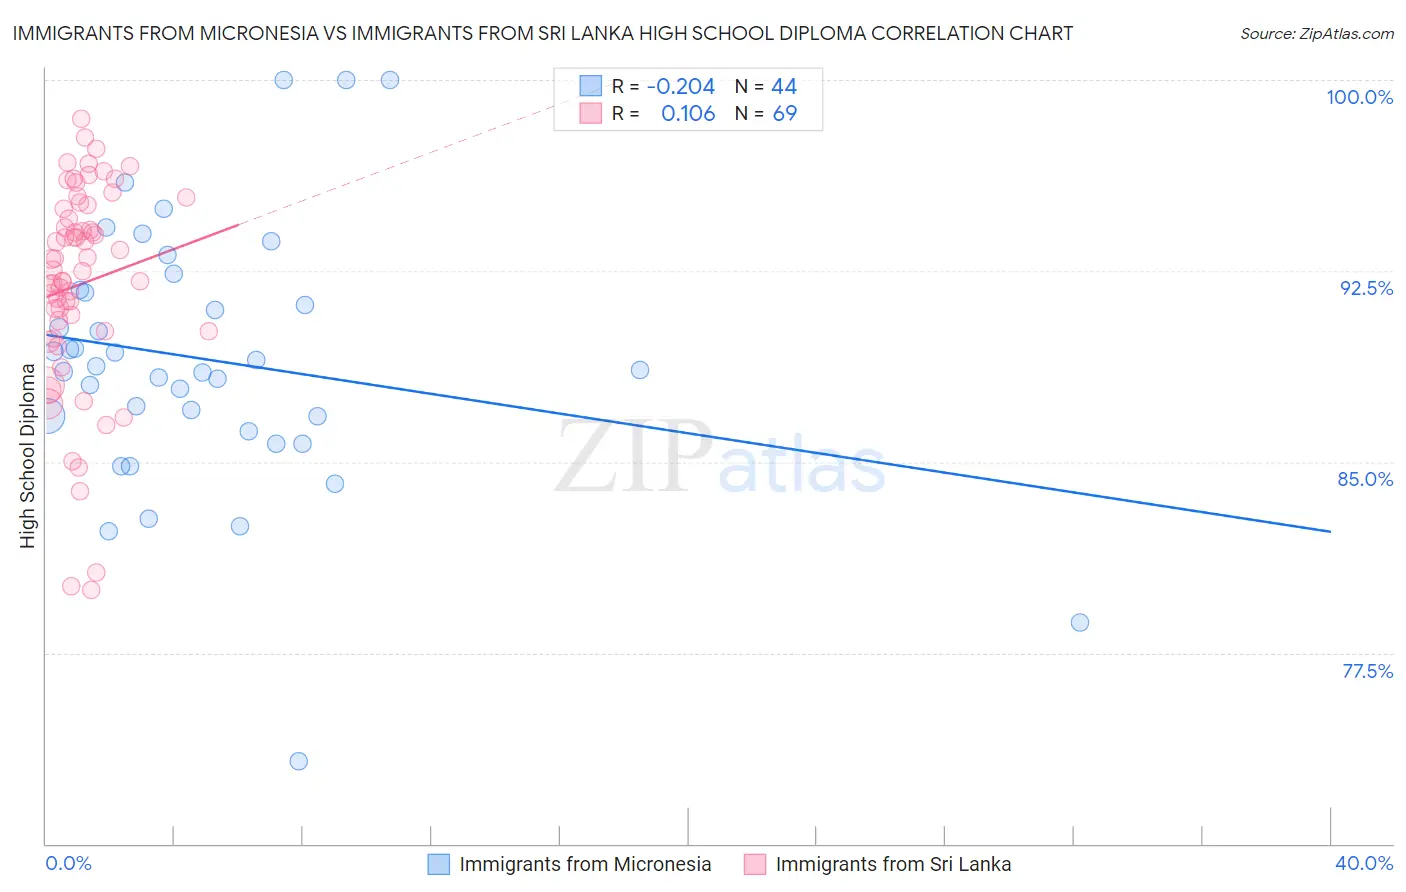
Immigrants from Micronesia vs Immigrants from Sri Lanka High School Diploma Correlation Chart
The statistical analysis conducted on geographies consisting of 61,609,499 people shows a weak negative correlation between the proportion of Immigrants from Micronesia and percentage of population with at least high school diploma education in the United States with a correlation coefficient (R) of -0.204 and weighted average of 88.6%. Similarly, the statistical analysis conducted on geographies consisting of 149,700,552 people shows a poor positive correlation between the proportion of Immigrants from Sri Lanka and percentage of population with at least high school diploma education in the United States with a correlation coefficient (R) of 0.106 and weighted average of 90.2%, a difference of 1.9%.
High School Diploma Correlation Summary
| Measurement | Immigrants from Micronesia | Immigrants from Sri Lanka |
| Minimum | 73.2% | 80.0% |
| Maximum | 100.0% | 98.5% |
| Range | 26.8% | 18.5% |
| Mean | 89.0% | 92.0% |
| Median | 88.7% | 92.5% |
| Interquartile 25% (IQ1) | 86.5% | 90.1% |
| Interquartile 75% (IQ3) | 91.7% | 95.0% |
| Interquartile Range (IQR) | 5.2% | 4.9% |
| Standard Deviation (Sample) | 5.2% | 4.1% |
| Standard Deviation (Population) | 5.1% | 4.1% |
Similar Demographics by High School Diploma
Demographics Similar to Immigrants from Micronesia by High School Diploma
In terms of high school diploma, the demographic groups most similar to Immigrants from Micronesia are Arapaho (88.6%, a difference of 0.010%), Armenian (88.6%, a difference of 0.020%), Immigrants from Sierra Leone (88.6%, a difference of 0.020%), Somali (88.6%, a difference of 0.030%), and Panamanian (88.6%, a difference of 0.040%).
| Demographics | Rating | Rank | High School Diploma |
| Liberians | 18.8 /100 | #198 | Poor 88.7% |
| Marshallese | 18.7 /100 | #199 | Poor 88.6% |
| Hawaiians | 18.3 /100 | #200 | Poor 88.6% |
| Koreans | 18.1 /100 | #201 | Poor 88.6% |
| Panamanians | 18.0 /100 | #202 | Poor 88.6% |
| Somalis | 17.5 /100 | #203 | Poor 88.6% |
| Armenians | 17.2 /100 | #204 | Poor 88.6% |
| Immigrants | Micronesia | 16.4 /100 | #205 | Poor 88.6% |
| Arapaho | 16.1 /100 | #206 | Poor 88.6% |
| Immigrants | Sierra Leone | 15.8 /100 | #207 | Poor 88.6% |
| Portuguese | 14.4 /100 | #208 | Poor 88.5% |
| Cherokee | 14.3 /100 | #209 | Poor 88.5% |
| Samoans | 14.0 /100 | #210 | Poor 88.5% |
| Inupiat | 13.1 /100 | #211 | Poor 88.5% |
| South American Indians | 12.2 /100 | #212 | Poor 88.5% |
Demographics Similar to Immigrants from Sri Lanka by High School Diploma
In terms of high school diploma, the demographic groups most similar to Immigrants from Sri Lanka are Immigrants from Belarus (90.2%, a difference of 0.010%), Yugoslavian (90.2%, a difference of 0.010%), Immigrants from Greece (90.3%, a difference of 0.030%), Menominee (90.3%, a difference of 0.030%), and Palestinian (90.3%, a difference of 0.050%).
| Demographics | Rating | Rank | High School Diploma |
| Syrians | 97.0 /100 | #106 | Exceptional 90.3% |
| Immigrants | Russia | 96.9 /100 | #107 | Exceptional 90.3% |
| Palestinians | 96.7 /100 | #108 | Exceptional 90.3% |
| Immigrants | Zimbabwe | 96.7 /100 | #109 | Exceptional 90.3% |
| Immigrants | Greece | 96.6 /100 | #110 | Exceptional 90.3% |
| Menominee | 96.6 /100 | #111 | Exceptional 90.3% |
| Immigrants | Belarus | 96.4 /100 | #112 | Exceptional 90.2% |
| Immigrants | Sri Lanka | 96.3 /100 | #113 | Exceptional 90.2% |
| Yugoslavians | 96.2 /100 | #114 | Exceptional 90.2% |
| Immigrants | Hungary | 95.8 /100 | #115 | Exceptional 90.2% |
| Immigrants | Germany | 95.7 /100 | #116 | Exceptional 90.2% |
| Jordanians | 95.4 /100 | #117 | Exceptional 90.2% |
| Israelis | 95.1 /100 | #118 | Exceptional 90.1% |
| Immigrants | Eastern Europe | 94.9 /100 | #119 | Exceptional 90.1% |
| Ottawa | 94.4 /100 | #120 | Exceptional 90.1% |