Immigrants from Cabo Verde vs Ethiopian High School Diploma
COMPARE
Immigrants from Cabo Verde
Ethiopian
High School Diploma
High School Diploma Comparison
Immigrants from Cabo Verde
Ethiopians
83.3%
HIGH SCHOOL DIPLOMA
0.0/ 100
METRIC RATING
324th/ 347
METRIC RANK
89.0%
HIGH SCHOOL DIPLOMA
37.0/ 100
METRIC RATING
185th/ 347
METRIC RANK
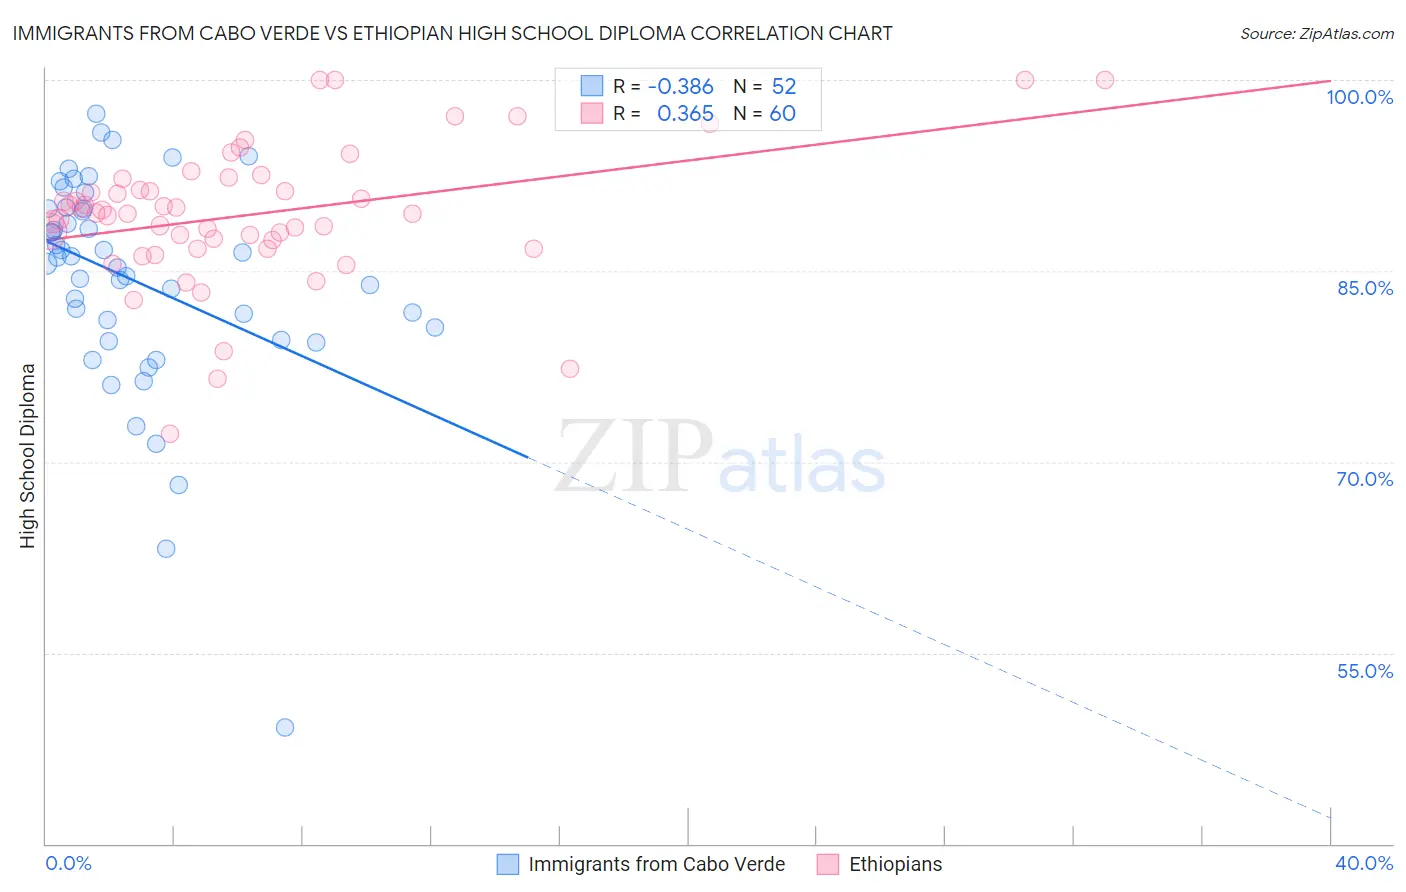
Immigrants from Cabo Verde vs Ethiopian High School Diploma Correlation Chart
The statistical analysis conducted on geographies consisting of 38,158,504 people shows a mild negative correlation between the proportion of Immigrants from Cabo Verde and percentage of population with at least high school diploma education in the United States with a correlation coefficient (R) of -0.386 and weighted average of 83.3%. Similarly, the statistical analysis conducted on geographies consisting of 223,235,367 people shows a mild positive correlation between the proportion of Ethiopians and percentage of population with at least high school diploma education in the United States with a correlation coefficient (R) of 0.365 and weighted average of 89.0%, a difference of 6.8%.
High School Diploma Correlation Summary
| Measurement | Immigrants from Cabo Verde | Ethiopian |
| Minimum | 49.2% | 72.2% |
| Maximum | 97.4% | 100.0% |
| Range | 48.2% | 27.8% |
| Mean | 84.2% | 89.4% |
| Median | 85.8% | 89.5% |
| Interquartile 25% (IQ1) | 80.1% | 87.1% |
| Interquartile 75% (IQ3) | 89.9% | 91.8% |
| Interquartile Range (IQR) | 9.8% | 4.7% |
| Standard Deviation (Sample) | 8.7% | 5.4% |
| Standard Deviation (Population) | 8.6% | 5.4% |
Similar Demographics by High School Diploma
Demographics Similar to Immigrants from Cabo Verde by High School Diploma
In terms of high school diploma, the demographic groups most similar to Immigrants from Cabo Verde are Immigrants from Nicaragua (83.1%, a difference of 0.23%), Immigrants from Cuba (83.5%, a difference of 0.29%), Mexican American Indian (83.0%, a difference of 0.30%), Honduran (83.0%, a difference of 0.34%), and Dominican (82.9%, a difference of 0.39%).
| Demographics | Rating | Rank | High School Diploma |
| Immigrants | Caribbean | 0.0 /100 | #317 | Tragic 84.3% |
| Immigrants | Belize | 0.0 /100 | #318 | Tragic 84.2% |
| Central American Indians | 0.0 /100 | #319 | Tragic 84.2% |
| Nicaraguans | 0.0 /100 | #320 | Tragic 84.1% |
| Yuman | 0.0 /100 | #321 | Tragic 84.0% |
| Lumbee | 0.0 /100 | #322 | Tragic 83.6% |
| Immigrants | Cuba | 0.0 /100 | #323 | Tragic 83.5% |
| Immigrants | Cabo Verde | 0.0 /100 | #324 | Tragic 83.3% |
| Immigrants | Nicaragua | 0.0 /100 | #325 | Tragic 83.1% |
| Mexican American Indians | 0.0 /100 | #326 | Tragic 83.0% |
| Hondurans | 0.0 /100 | #327 | Tragic 83.0% |
| Dominicans | 0.0 /100 | #328 | Tragic 82.9% |
| Hispanics or Latinos | 0.0 /100 | #329 | Tragic 82.9% |
| Immigrants | Azores | 0.0 /100 | #330 | Tragic 82.8% |
| Central Americans | 0.0 /100 | #331 | Tragic 82.5% |
Demographics Similar to Ethiopians by High School Diploma
In terms of high school diploma, the demographic groups most similar to Ethiopians are Immigrants from Eastern Africa (88.9%, a difference of 0.020%), Guamanian/Chamorro (88.9%, a difference of 0.020%), Immigrants from Syria (89.0%, a difference of 0.040%), Immigrants from Sudan (88.9%, a difference of 0.060%), and Immigrants from Uganda (88.9%, a difference of 0.070%).
| Demographics | Rating | Rank | High School Diploma |
| Sierra Leoneans | 48.4 /100 | #178 | Average 89.1% |
| Americans | 47.2 /100 | #179 | Average 89.1% |
| Bolivians | 45.2 /100 | #180 | Average 89.1% |
| Venezuelans | 43.6 /100 | #181 | Average 89.1% |
| Spaniards | 43.4 /100 | #182 | Average 89.1% |
| Potawatomi | 42.5 /100 | #183 | Average 89.0% |
| Immigrants | Syria | 39.2 /100 | #184 | Fair 89.0% |
| Ethiopians | 37.0 /100 | #185 | Fair 89.0% |
| Immigrants | Eastern Africa | 35.8 /100 | #186 | Fair 88.9% |
| Guamanians/Chamorros | 35.5 /100 | #187 | Fair 88.9% |
| Immigrants | Sudan | 33.4 /100 | #188 | Fair 88.9% |
| Immigrants | Uganda | 32.6 /100 | #189 | Fair 88.9% |
| Immigrants | Chile | 31.9 /100 | #190 | Fair 88.9% |
| Immigrants | Ethiopia | 30.9 /100 | #191 | Fair 88.9% |
| Moroccans | 29.5 /100 | #192 | Fair 88.8% |