Immigrants from Malaysia vs Immigrants from Lithuania 12th Grade, No Diploma
COMPARE
Immigrants from Malaysia
Immigrants from Lithuania
12th Grade, No Diploma
12th Grade, No Diploma Comparison
Immigrants from Malaysia
Immigrants from Lithuania
91.3%
12TH GRADE, NO DIPLOMA
57.8/ 100
METRIC RATING
167th/ 347
METRIC RANK
93.1%
12TH GRADE, NO DIPLOMA
99.9/ 100
METRIC RATING
30th/ 347
METRIC RANK
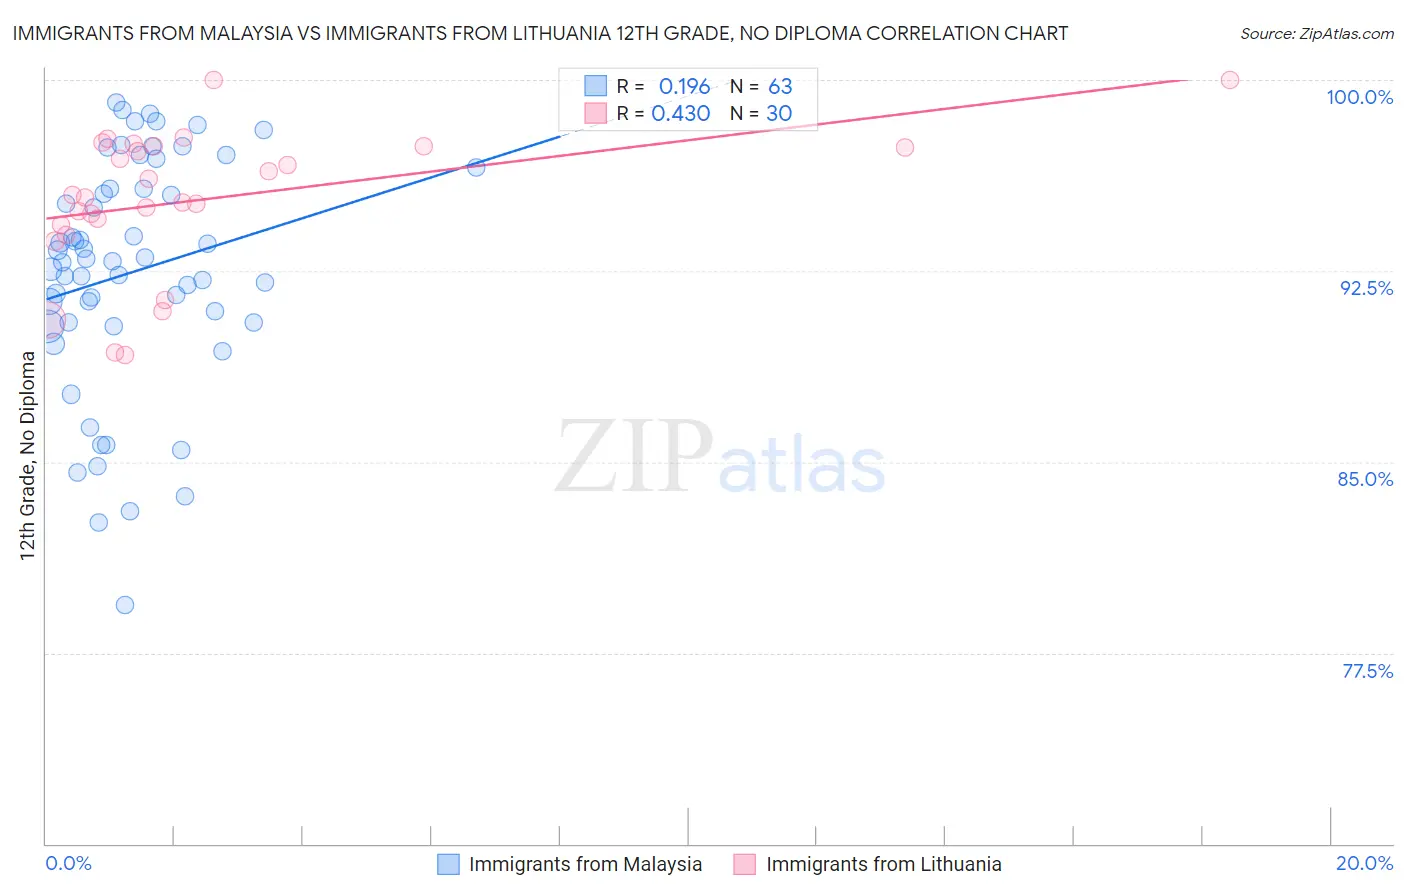
Immigrants from Malaysia vs Immigrants from Lithuania 12th Grade, No Diploma Correlation Chart
The statistical analysis conducted on geographies consisting of 197,973,709 people shows a poor positive correlation between the proportion of Immigrants from Malaysia and percentage of population with at least 12th grade (no diploma) education in the United States with a correlation coefficient (R) of 0.196 and weighted average of 91.3%. Similarly, the statistical analysis conducted on geographies consisting of 117,724,932 people shows a moderate positive correlation between the proportion of Immigrants from Lithuania and percentage of population with at least 12th grade (no diploma) education in the United States with a correlation coefficient (R) of 0.430 and weighted average of 93.1%, a difference of 2.0%.
12th Grade, No Diploma Correlation Summary
| Measurement | Immigrants from Malaysia | Immigrants from Lithuania |
| Minimum | 79.4% | 89.2% |
| Maximum | 99.1% | 100.0% |
| Range | 19.7% | 10.8% |
| Mean | 92.4% | 95.3% |
| Median | 92.9% | 95.4% |
| Interquartile 25% (IQ1) | 90.5% | 94.3% |
| Interquartile 75% (IQ3) | 95.8% | 97.4% |
| Interquartile Range (IQR) | 5.3% | 3.1% |
| Standard Deviation (Sample) | 4.6% | 2.8% |
| Standard Deviation (Population) | 4.5% | 2.7% |
Similar Demographics by 12th Grade, No Diploma
Demographics Similar to Immigrants from Malaysia by 12th Grade, No Diploma
In terms of 12th grade, no diploma, the demographic groups most similar to Immigrants from Malaysia are Hmong (91.3%, a difference of 0.0%), Alsatian (91.3%, a difference of 0.010%), Cree (91.2%, a difference of 0.010%), Immigrants from China (91.3%, a difference of 0.040%), and Immigrants from Indonesia (91.2%, a difference of 0.040%).
| Demographics | Rating | Rank | 12th Grade, No Diploma |
| Immigrants | Albania | 64.1 /100 | #160 | Good 91.3% |
| Immigrants | Hong Kong | 63.8 /100 | #161 | Good 91.3% |
| Brazilians | 62.0 /100 | #162 | Good 91.3% |
| Immigrants | Asia | 61.5 /100 | #163 | Good 91.3% |
| Immigrants | China | 60.9 /100 | #164 | Good 91.3% |
| Alsatians | 58.3 /100 | #165 | Average 91.3% |
| Hmong | 58.0 /100 | #166 | Average 91.3% |
| Immigrants | Malaysia | 57.8 /100 | #167 | Average 91.3% |
| Cree | 57.0 /100 | #168 | Average 91.2% |
| Immigrants | Indonesia | 54.9 /100 | #169 | Average 91.2% |
| Delaware | 52.8 /100 | #170 | Average 91.2% |
| Immigrants | Morocco | 51.4 /100 | #171 | Average 91.2% |
| Bermudans | 50.8 /100 | #172 | Average 91.2% |
| Bolivians | 50.4 /100 | #173 | Average 91.2% |
| Immigrants | Nepal | 50.0 /100 | #174 | Average 91.2% |
Demographics Similar to Immigrants from Lithuania by 12th Grade, No Diploma
In terms of 12th grade, no diploma, the demographic groups most similar to Immigrants from Lithuania are Iranian (93.1%, a difference of 0.0%), Immigrants from Northern Europe (93.1%, a difference of 0.010%), Immigrants from Ireland (93.1%, a difference of 0.020%), European (93.1%, a difference of 0.030%), and Cypriot (93.1%, a difference of 0.060%).
| Demographics | Rating | Rank | 12th Grade, No Diploma |
| Scandinavians | 99.9 /100 | #23 | Exceptional 93.2% |
| Thais | 99.9 /100 | #24 | Exceptional 93.2% |
| Czechs | 99.9 /100 | #25 | Exceptional 93.2% |
| Russians | 99.9 /100 | #26 | Exceptional 93.2% |
| Cypriots | 99.9 /100 | #27 | Exceptional 93.1% |
| Immigrants | Northern Europe | 99.9 /100 | #28 | Exceptional 93.1% |
| Iranians | 99.9 /100 | #29 | Exceptional 93.1% |
| Immigrants | Lithuania | 99.9 /100 | #30 | Exceptional 93.1% |
| Immigrants | Ireland | 99.9 /100 | #31 | Exceptional 93.1% |
| Europeans | 99.9 /100 | #32 | Exceptional 93.1% |
| Immigrants | Scotland | 99.9 /100 | #33 | Exceptional 93.0% |
| Okinawans | 99.9 /100 | #34 | Exceptional 93.0% |
| English | 99.9 /100 | #35 | Exceptional 93.0% |
| Scottish | 99.9 /100 | #36 | Exceptional 93.0% |
| Irish | 99.9 /100 | #37 | Exceptional 93.0% |