Immigrants from Malaysia vs Immigrants from Cambodia 12th Grade, No Diploma
COMPARE
Immigrants from Malaysia
Immigrants from Cambodia
12th Grade, No Diploma
12th Grade, No Diploma Comparison
Immigrants from Malaysia
Immigrants from Cambodia
91.3%
12TH GRADE, NO DIPLOMA
57.8/ 100
METRIC RATING
167th/ 347
METRIC RANK
88.1%
12TH GRADE, NO DIPLOMA
0.0/ 100
METRIC RATING
301st/ 347
METRIC RANK
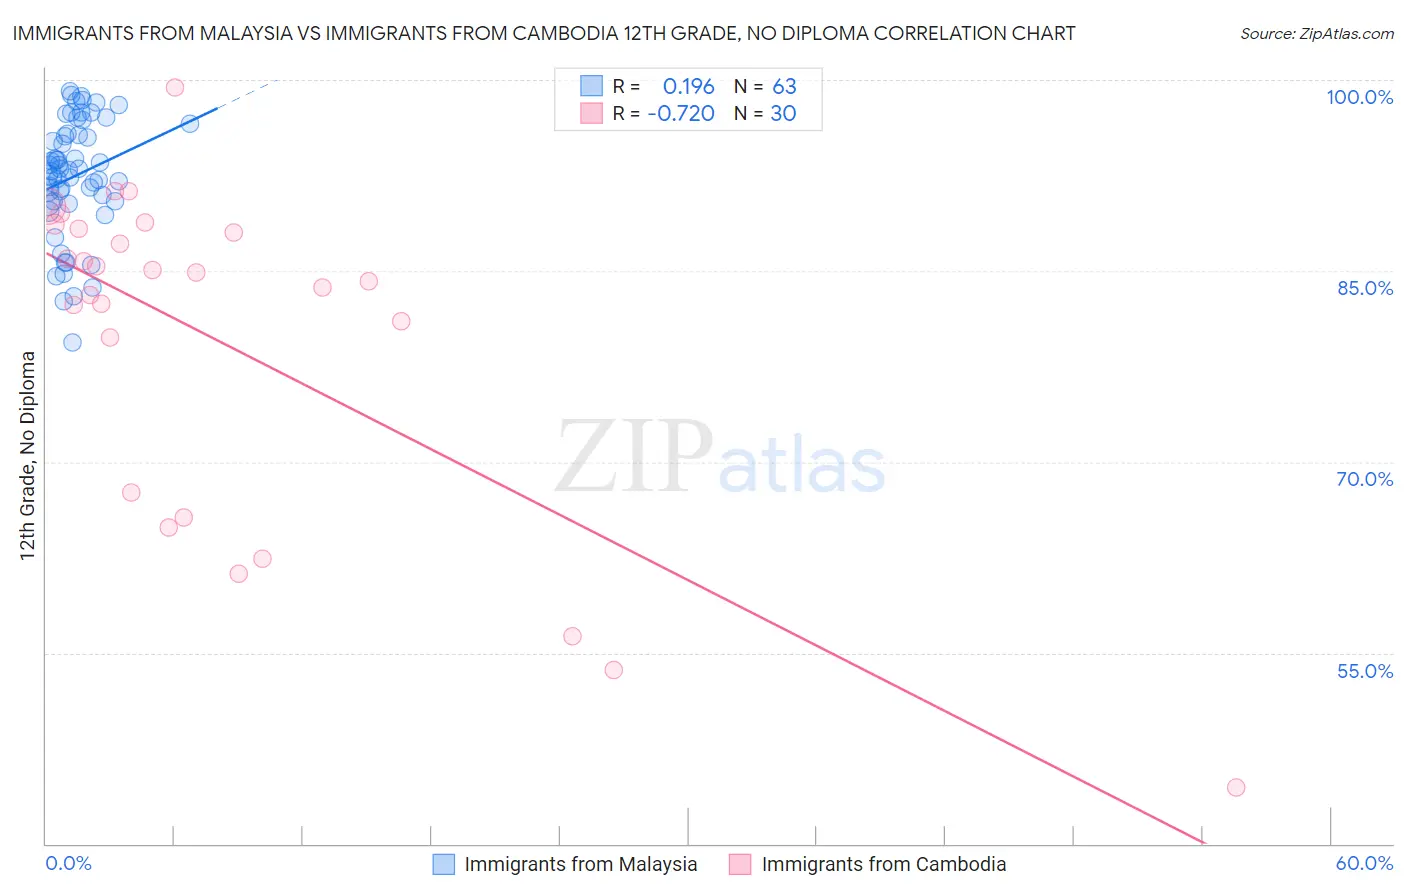
Immigrants from Malaysia vs Immigrants from Cambodia 12th Grade, No Diploma Correlation Chart
The statistical analysis conducted on geographies consisting of 197,973,709 people shows a poor positive correlation between the proportion of Immigrants from Malaysia and percentage of population with at least 12th grade (no diploma) education in the United States with a correlation coefficient (R) of 0.196 and weighted average of 91.3%. Similarly, the statistical analysis conducted on geographies consisting of 205,153,442 people shows a strong negative correlation between the proportion of Immigrants from Cambodia and percentage of population with at least 12th grade (no diploma) education in the United States with a correlation coefficient (R) of -0.720 and weighted average of 88.1%, a difference of 3.6%.
12th Grade, No Diploma Correlation Summary
| Measurement | Immigrants from Malaysia | Immigrants from Cambodia |
| Minimum | 79.4% | 44.4% |
| Maximum | 99.1% | 99.4% |
| Range | 19.7% | 54.9% |
| Mean | 92.4% | 79.4% |
| Median | 92.9% | 84.6% |
| Interquartile 25% (IQ1) | 90.5% | 67.6% |
| Interquartile 75% (IQ3) | 95.8% | 88.3% |
| Interquartile Range (IQR) | 5.3% | 20.8% |
| Standard Deviation (Sample) | 4.6% | 13.3% |
| Standard Deviation (Population) | 4.5% | 13.1% |
Similar Demographics by 12th Grade, No Diploma
Demographics Similar to Immigrants from Malaysia by 12th Grade, No Diploma
In terms of 12th grade, no diploma, the demographic groups most similar to Immigrants from Malaysia are Hmong (91.3%, a difference of 0.0%), Alsatian (91.3%, a difference of 0.010%), Cree (91.2%, a difference of 0.010%), Immigrants from China (91.3%, a difference of 0.040%), and Immigrants from Indonesia (91.2%, a difference of 0.040%).
| Demographics | Rating | Rank | 12th Grade, No Diploma |
| Immigrants | Albania | 64.1 /100 | #160 | Good 91.3% |
| Immigrants | Hong Kong | 63.8 /100 | #161 | Good 91.3% |
| Brazilians | 62.0 /100 | #162 | Good 91.3% |
| Immigrants | Asia | 61.5 /100 | #163 | Good 91.3% |
| Immigrants | China | 60.9 /100 | #164 | Good 91.3% |
| Alsatians | 58.3 /100 | #165 | Average 91.3% |
| Hmong | 58.0 /100 | #166 | Average 91.3% |
| Immigrants | Malaysia | 57.8 /100 | #167 | Average 91.3% |
| Cree | 57.0 /100 | #168 | Average 91.2% |
| Immigrants | Indonesia | 54.9 /100 | #169 | Average 91.2% |
| Delaware | 52.8 /100 | #170 | Average 91.2% |
| Immigrants | Morocco | 51.4 /100 | #171 | Average 91.2% |
| Bermudans | 50.8 /100 | #172 | Average 91.2% |
| Bolivians | 50.4 /100 | #173 | Average 91.2% |
| Immigrants | Nepal | 50.0 /100 | #174 | Average 91.2% |
Demographics Similar to Immigrants from Cambodia by 12th Grade, No Diploma
In terms of 12th grade, no diploma, the demographic groups most similar to Immigrants from Cambodia are Immigrants from Guyana (88.1%, a difference of 0.0%), Ecuadorian (88.0%, a difference of 0.030%), Nepalese (88.1%, a difference of 0.050%), Immigrants from Haiti (88.2%, a difference of 0.090%), and Immigrants from Bangladesh (88.0%, a difference of 0.13%).
| Demographics | Rating | Rank | 12th Grade, No Diploma |
| Guyanese | 0.0 /100 | #294 | Tragic 88.3% |
| Immigrants | Immigrants | 0.0 /100 | #295 | Tragic 88.2% |
| Fijians | 0.0 /100 | #296 | Tragic 88.2% |
| Pueblo | 0.0 /100 | #297 | Tragic 88.2% |
| Immigrants | Haiti | 0.0 /100 | #298 | Tragic 88.2% |
| Nepalese | 0.0 /100 | #299 | Tragic 88.1% |
| Immigrants | Guyana | 0.0 /100 | #300 | Tragic 88.1% |
| Immigrants | Cambodia | 0.0 /100 | #301 | Tragic 88.1% |
| Ecuadorians | 0.0 /100 | #302 | Tragic 88.0% |
| Immigrants | Bangladesh | 0.0 /100 | #303 | Tragic 88.0% |
| Vietnamese | 0.0 /100 | #304 | Tragic 87.9% |
| Immigrants | Dominica | 0.0 /100 | #305 | Tragic 87.7% |
| Natives/Alaskans | 0.0 /100 | #306 | Tragic 87.7% |
| Immigrants | Portugal | 0.0 /100 | #307 | Tragic 87.6% |
| Yup'ik | 0.0 /100 | #308 | Tragic 87.6% |