Immigrants from Haiti vs Immigrants from Lithuania 12th Grade, No Diploma
COMPARE
Immigrants from Haiti
Immigrants from Lithuania
12th Grade, No Diploma
12th Grade, No Diploma Comparison
Immigrants from Haiti
Immigrants from Lithuania
88.2%
12TH GRADE, NO DIPLOMA
0.0/ 100
METRIC RATING
298th/ 347
METRIC RANK
93.1%
12TH GRADE, NO DIPLOMA
99.9/ 100
METRIC RATING
30th/ 347
METRIC RANK
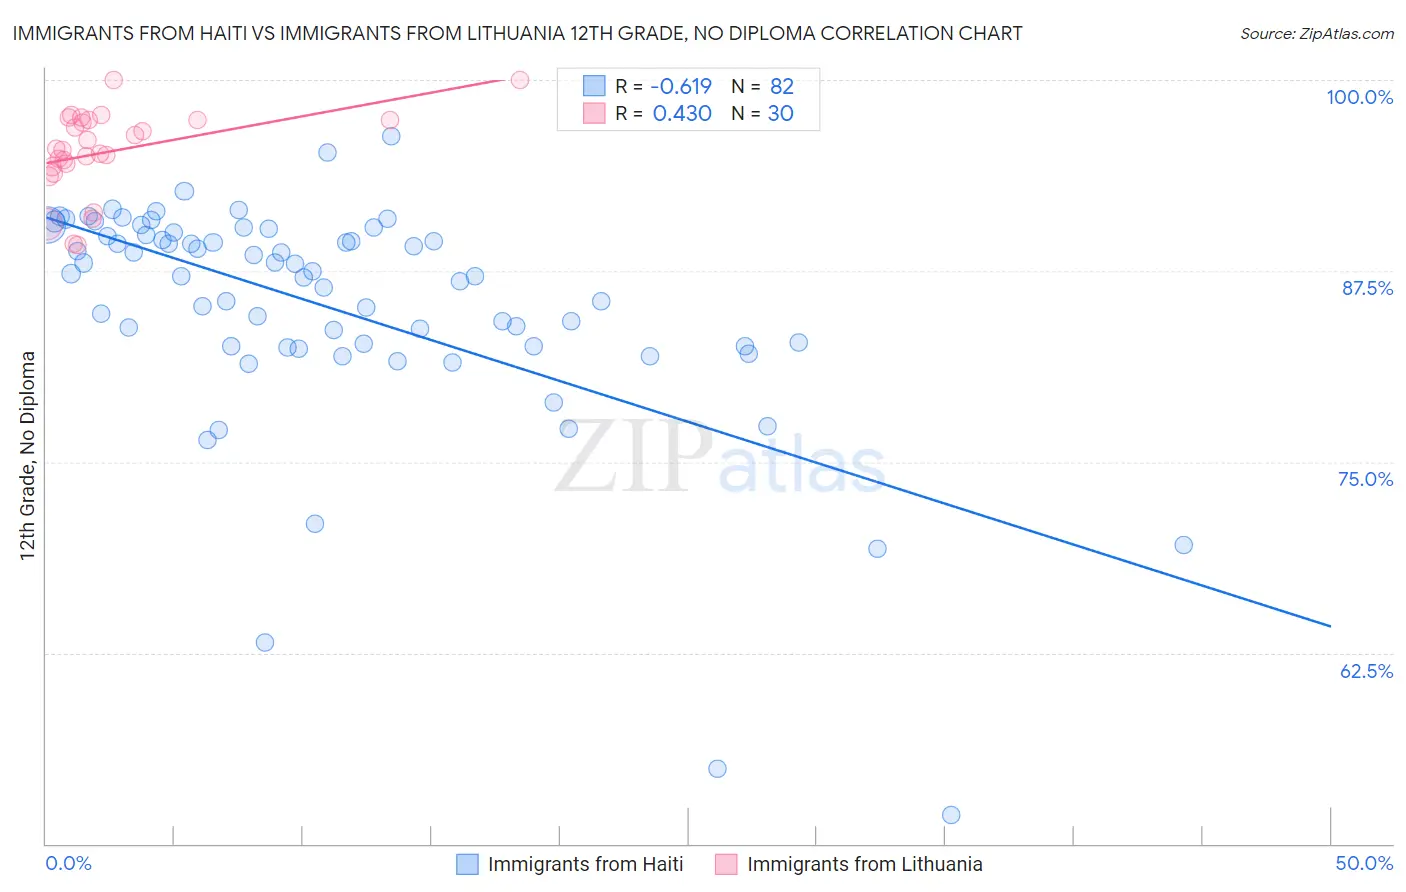
Immigrants from Haiti vs Immigrants from Lithuania 12th Grade, No Diploma Correlation Chart
The statistical analysis conducted on geographies consisting of 225,286,636 people shows a significant negative correlation between the proportion of Immigrants from Haiti and percentage of population with at least 12th grade (no diploma) education in the United States with a correlation coefficient (R) of -0.619 and weighted average of 88.2%. Similarly, the statistical analysis conducted on geographies consisting of 117,724,932 people shows a moderate positive correlation between the proportion of Immigrants from Lithuania and percentage of population with at least 12th grade (no diploma) education in the United States with a correlation coefficient (R) of 0.430 and weighted average of 93.1%, a difference of 5.6%.
12th Grade, No Diploma Correlation Summary
| Measurement | Immigrants from Haiti | Immigrants from Lithuania |
| Minimum | 51.9% | 89.2% |
| Maximum | 96.4% | 100.0% |
| Range | 44.4% | 10.8% |
| Mean | 85.1% | 95.3% |
| Median | 87.2% | 95.4% |
| Interquartile 25% (IQ1) | 82.6% | 94.3% |
| Interquartile 75% (IQ3) | 89.9% | 97.4% |
| Interquartile Range (IQR) | 7.3% | 3.1% |
| Standard Deviation (Sample) | 7.7% | 2.8% |
| Standard Deviation (Population) | 7.6% | 2.7% |
Similar Demographics by 12th Grade, No Diploma
Demographics Similar to Immigrants from Haiti by 12th Grade, No Diploma
In terms of 12th grade, no diploma, the demographic groups most similar to Immigrants from Haiti are Nepalese (88.1%, a difference of 0.040%), Pueblo (88.2%, a difference of 0.050%), Fijian (88.2%, a difference of 0.060%), Immigrants (88.2%, a difference of 0.080%), and Immigrants from Guyana (88.1%, a difference of 0.090%).
| Demographics | Rating | Rank | 12th Grade, No Diploma |
| Haitians | 0.0 /100 | #291 | Tragic 88.5% |
| Immigrants | Grenada | 0.0 /100 | #292 | Tragic 88.4% |
| Japanese | 0.0 /100 | #293 | Tragic 88.3% |
| Guyanese | 0.0 /100 | #294 | Tragic 88.3% |
| Immigrants | Immigrants | 0.0 /100 | #295 | Tragic 88.2% |
| Fijians | 0.0 /100 | #296 | Tragic 88.2% |
| Pueblo | 0.0 /100 | #297 | Tragic 88.2% |
| Immigrants | Haiti | 0.0 /100 | #298 | Tragic 88.2% |
| Nepalese | 0.0 /100 | #299 | Tragic 88.1% |
| Immigrants | Guyana | 0.0 /100 | #300 | Tragic 88.1% |
| Immigrants | Cambodia | 0.0 /100 | #301 | Tragic 88.1% |
| Ecuadorians | 0.0 /100 | #302 | Tragic 88.0% |
| Immigrants | Bangladesh | 0.0 /100 | #303 | Tragic 88.0% |
| Vietnamese | 0.0 /100 | #304 | Tragic 87.9% |
| Immigrants | Dominica | 0.0 /100 | #305 | Tragic 87.7% |
Demographics Similar to Immigrants from Lithuania by 12th Grade, No Diploma
In terms of 12th grade, no diploma, the demographic groups most similar to Immigrants from Lithuania are Iranian (93.1%, a difference of 0.0%), Immigrants from Northern Europe (93.1%, a difference of 0.010%), Immigrants from Ireland (93.1%, a difference of 0.020%), European (93.1%, a difference of 0.030%), and Cypriot (93.1%, a difference of 0.060%).
| Demographics | Rating | Rank | 12th Grade, No Diploma |
| Scandinavians | 99.9 /100 | #23 | Exceptional 93.2% |
| Thais | 99.9 /100 | #24 | Exceptional 93.2% |
| Czechs | 99.9 /100 | #25 | Exceptional 93.2% |
| Russians | 99.9 /100 | #26 | Exceptional 93.2% |
| Cypriots | 99.9 /100 | #27 | Exceptional 93.1% |
| Immigrants | Northern Europe | 99.9 /100 | #28 | Exceptional 93.1% |
| Iranians | 99.9 /100 | #29 | Exceptional 93.1% |
| Immigrants | Lithuania | 99.9 /100 | #30 | Exceptional 93.1% |
| Immigrants | Ireland | 99.9 /100 | #31 | Exceptional 93.1% |
| Europeans | 99.9 /100 | #32 | Exceptional 93.1% |
| Immigrants | Scotland | 99.9 /100 | #33 | Exceptional 93.0% |
| Okinawans | 99.9 /100 | #34 | Exceptional 93.0% |
| English | 99.9 /100 | #35 | Exceptional 93.0% |
| Scottish | 99.9 /100 | #36 | Exceptional 93.0% |
| Irish | 99.9 /100 | #37 | Exceptional 93.0% |