Immigrants from Malaysia vs Nicaraguan Master's Degree
COMPARE
Immigrants from Malaysia
Nicaraguan
Master's Degree
Master's Degree Comparison
Immigrants from Malaysia
Nicaraguans
18.9%
MASTER'S DEGREE
100.0/ 100
METRIC RATING
44th/ 347
METRIC RANK
12.5%
MASTER'S DEGREE
0.6/ 100
METRIC RATING
262nd/ 347
METRIC RANK
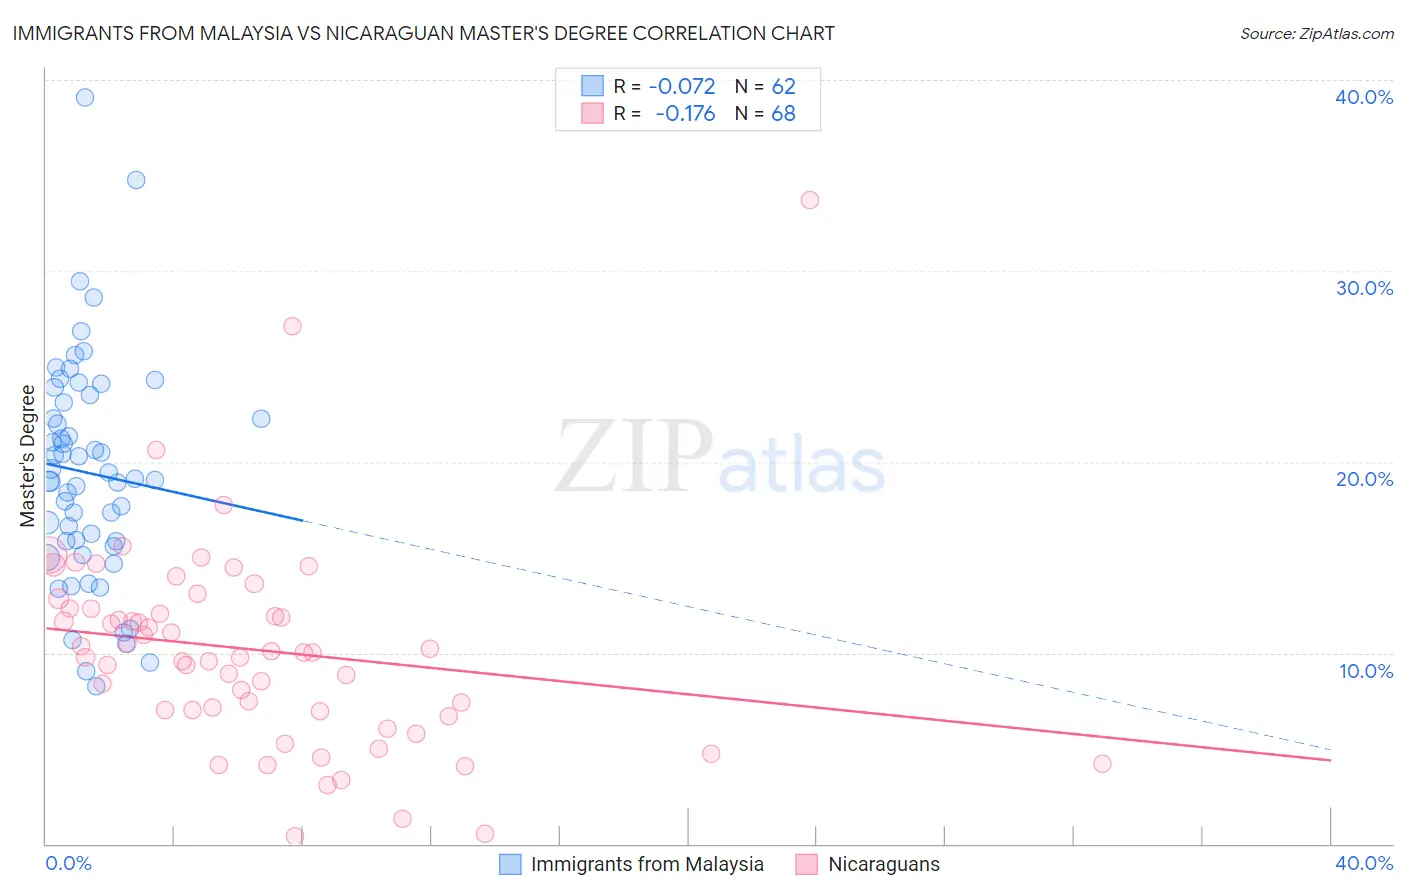
Immigrants from Malaysia vs Nicaraguan Master's Degree Correlation Chart
The statistical analysis conducted on geographies consisting of 197,962,385 people shows a slight negative correlation between the proportion of Immigrants from Malaysia and percentage of population with at least master's degree education in the United States with a correlation coefficient (R) of -0.072 and weighted average of 18.9%. Similarly, the statistical analysis conducted on geographies consisting of 285,672,078 people shows a poor negative correlation between the proportion of Nicaraguans and percentage of population with at least master's degree education in the United States with a correlation coefficient (R) of -0.176 and weighted average of 12.5%, a difference of 51.7%.
Master's Degree Correlation Summary
| Measurement | Immigrants from Malaysia | Nicaraguan |
| Minimum | 8.3% | 0.42% |
| Maximum | 39.1% | 33.7% |
| Range | 30.8% | 33.3% |
| Mean | 19.4% | 10.2% |
| Median | 19.1% | 10.0% |
| Interquartile 25% (IQ1) | 15.8% | 7.0% |
| Interquartile 75% (IQ3) | 23.1% | 12.3% |
| Interquartile Range (IQR) | 7.3% | 5.4% |
| Standard Deviation (Sample) | 5.9% | 5.5% |
| Standard Deviation (Population) | 5.8% | 5.4% |
Similar Demographics by Master's Degree
Demographics Similar to Immigrants from Malaysia by Master's Degree
In terms of master's degree, the demographic groups most similar to Immigrants from Malaysia are Immigrants from Belarus (18.9%, a difference of 0.11%), Immigrants from Greece (19.0%, a difference of 0.28%), Immigrants from Saudi Arabia (19.0%, a difference of 0.29%), Immigrants from Norway (18.8%, a difference of 0.50%), and Immigrants from Austria (18.8%, a difference of 0.51%).
| Demographics | Rating | Rank | Master's Degree |
| Mongolians | 100.0 /100 | #37 | Exceptional 19.4% |
| Bolivians | 100.0 /100 | #38 | Exceptional 19.3% |
| Immigrants | Spain | 100.0 /100 | #39 | Exceptional 19.1% |
| Immigrants | Bolivia | 100.0 /100 | #40 | Exceptional 19.1% |
| Immigrants | Latvia | 100.0 /100 | #41 | Exceptional 19.1% |
| Immigrants | Saudi Arabia | 100.0 /100 | #42 | Exceptional 19.0% |
| Immigrants | Greece | 100.0 /100 | #43 | Exceptional 19.0% |
| Immigrants | Malaysia | 100.0 /100 | #44 | Exceptional 18.9% |
| Immigrants | Belarus | 100.0 /100 | #45 | Exceptional 18.9% |
| Immigrants | Norway | 100.0 /100 | #46 | Exceptional 18.8% |
| Immigrants | Austria | 100.0 /100 | #47 | Exceptional 18.8% |
| Paraguayans | 100.0 /100 | #48 | Exceptional 18.8% |
| Estonians | 100.0 /100 | #49 | Exceptional 18.8% |
| Bulgarians | 100.0 /100 | #50 | Exceptional 18.8% |
| Immigrants | South Africa | 100.0 /100 | #51 | Exceptional 18.8% |
Demographics Similar to Nicaraguans by Master's Degree
In terms of master's degree, the demographic groups most similar to Nicaraguans are Tongan (12.5%, a difference of 0.18%), Dominican (12.5%, a difference of 0.22%), Japanese (12.5%, a difference of 0.23%), Central American Indian (12.4%, a difference of 0.23%), and Immigrants from Liberia (12.5%, a difference of 0.32%).
| Demographics | Rating | Rank | Master's Degree |
| Immigrants | Congo | 0.8 /100 | #255 | Tragic 12.6% |
| Immigrants | Portugal | 0.8 /100 | #256 | Tragic 12.6% |
| Osage | 0.7 /100 | #257 | Tragic 12.6% |
| Immigrants | Liberia | 0.6 /100 | #258 | Tragic 12.5% |
| Japanese | 0.6 /100 | #259 | Tragic 12.5% |
| Dominicans | 0.6 /100 | #260 | Tragic 12.5% |
| Tongans | 0.6 /100 | #261 | Tragic 12.5% |
| Nicaraguans | 0.6 /100 | #262 | Tragic 12.5% |
| Central American Indians | 0.5 /100 | #263 | Tragic 12.4% |
| Belizeans | 0.5 /100 | #264 | Tragic 12.4% |
| Immigrants | Fiji | 0.5 /100 | #265 | Tragic 12.4% |
| Bahamians | 0.5 /100 | #266 | Tragic 12.4% |
| Americans | 0.4 /100 | #267 | Tragic 12.3% |
| Native Hawaiians | 0.4 /100 | #268 | Tragic 12.3% |
| Central Americans | 0.3 /100 | #269 | Tragic 12.2% |