Immigrants from Liberia vs Slovene College, 1 year or more
COMPARE
Immigrants from Liberia
Slovene
College, 1 year or more
College, 1 year or more Comparison
Immigrants from Liberia
Slovenes
55.7%
COLLEGE, 1 YEAR OR MORE
0.8/ 100
METRIC RATING
245th/ 347
METRIC RANK
60.9%
COLLEGE, 1 YEAR OR MORE
86.5/ 100
METRIC RATING
137th/ 347
METRIC RANK
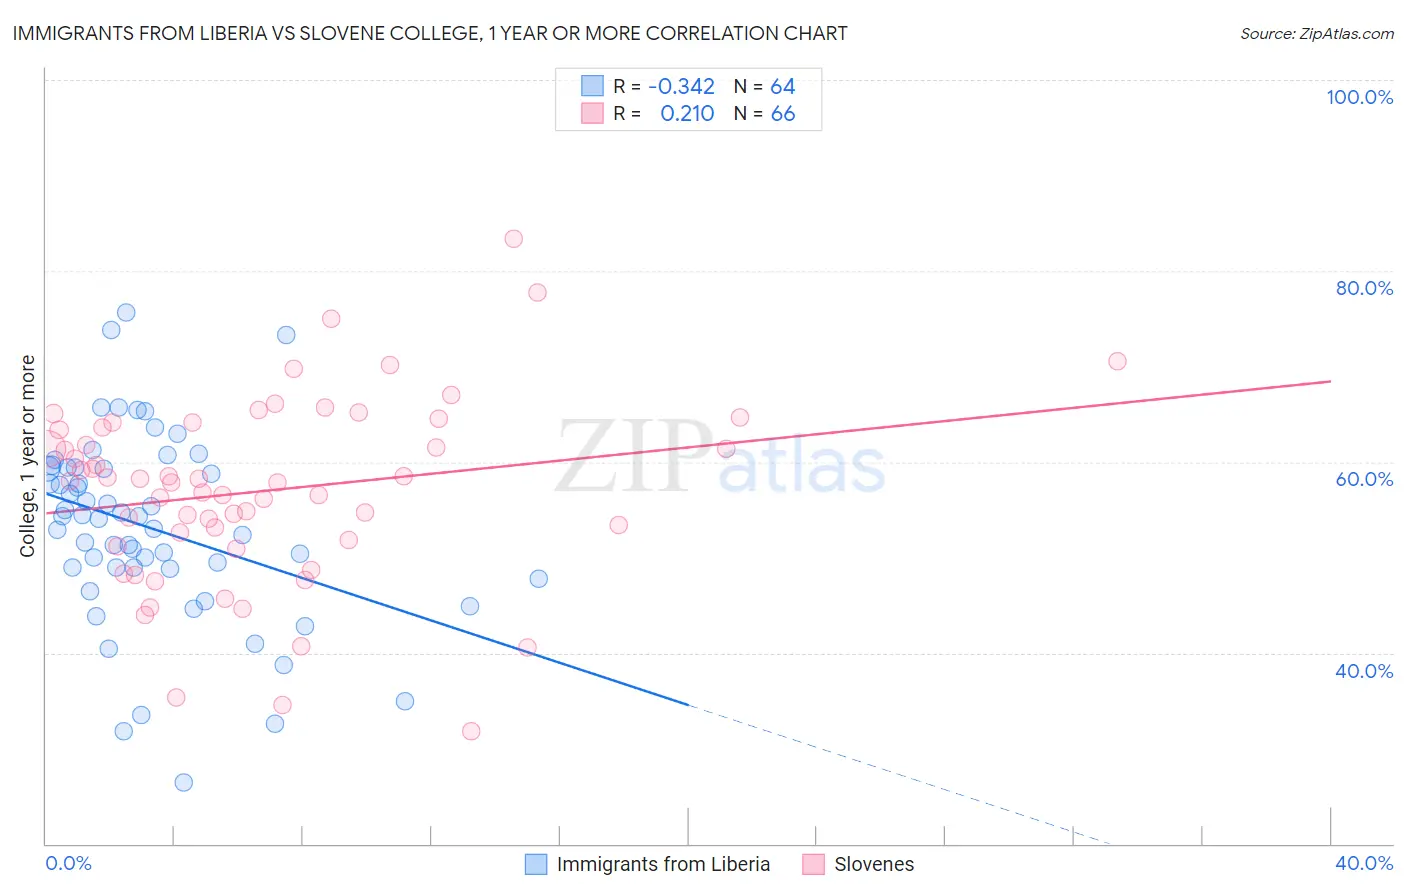
Immigrants from Liberia vs Slovene College, 1 year or more Correlation Chart
The statistical analysis conducted on geographies consisting of 135,295,665 people shows a mild negative correlation between the proportion of Immigrants from Liberia and percentage of population with at least college, 1 year or more education in the United States with a correlation coefficient (R) of -0.342 and weighted average of 55.7%. Similarly, the statistical analysis conducted on geographies consisting of 261,353,489 people shows a weak positive correlation between the proportion of Slovenes and percentage of population with at least college, 1 year or more education in the United States with a correlation coefficient (R) of 0.210 and weighted average of 60.9%, a difference of 9.4%.
College, 1 year or more Correlation Summary
| Measurement | Immigrants from Liberia | Slovene |
| Minimum | 26.5% | 31.8% |
| Maximum | 75.6% | 83.3% |
| Range | 49.1% | 51.5% |
| Mean | 53.1% | 57.0% |
| Median | 54.2% | 57.9% |
| Interquartile 25% (IQ1) | 48.9% | 51.8% |
| Interquartile 75% (IQ3) | 59.4% | 63.6% |
| Interquartile Range (IQR) | 10.5% | 11.8% |
| Standard Deviation (Sample) | 9.9% | 9.8% |
| Standard Deviation (Population) | 9.8% | 9.7% |
Similar Demographics by College, 1 year or more
Demographics Similar to Immigrants from Liberia by College, 1 year or more
In terms of college, 1 year or more, the demographic groups most similar to Immigrants from Liberia are Malaysian (55.6%, a difference of 0.050%), Chippewa (55.7%, a difference of 0.070%), Hawaiian (55.6%, a difference of 0.12%), Immigrants from Congo (55.6%, a difference of 0.16%), and Osage (55.8%, a difference of 0.19%).
| Demographics | Rating | Rank | College, 1 year or more |
| Barbadians | 1.3 /100 | #238 | Tragic 56.0% |
| Puget Sound Salish | 1.1 /100 | #239 | Tragic 55.9% |
| Trinidadians and Tobagonians | 1.1 /100 | #240 | Tragic 55.8% |
| French American Indians | 1.0 /100 | #241 | Tragic 55.8% |
| Marshallese | 1.0 /100 | #242 | Tragic 55.8% |
| Osage | 1.0 /100 | #243 | Tragic 55.8% |
| Chippewa | 0.9 /100 | #244 | Tragic 55.7% |
| Immigrants | Liberia | 0.8 /100 | #245 | Tragic 55.7% |
| Malaysians | 0.8 /100 | #246 | Tragic 55.6% |
| Hawaiians | 0.8 /100 | #247 | Tragic 55.6% |
| Immigrants | Congo | 0.8 /100 | #248 | Tragic 55.6% |
| Immigrants | Trinidad and Tobago | 0.7 /100 | #249 | Tragic 55.5% |
| Delaware | 0.7 /100 | #250 | Tragic 55.5% |
| Immigrants | Cambodia | 0.6 /100 | #251 | Tragic 55.4% |
| Aleuts | 0.6 /100 | #252 | Tragic 55.4% |
Demographics Similar to Slovenes by College, 1 year or more
In terms of college, 1 year or more, the demographic groups most similar to Slovenes are Basque (60.9%, a difference of 0.090%), Immigrants from Uganda (60.9%, a difference of 0.11%), Immigrants from Venezuela (61.0%, a difference of 0.16%), Immigrants from Uzbekistan (61.0%, a difference of 0.18%), and Scandinavian (61.0%, a difference of 0.20%).
| Demographics | Rating | Rank | College, 1 year or more |
| Italians | 89.5 /100 | #130 | Excellent 61.1% |
| Immigrants | Morocco | 89.5 /100 | #131 | Excellent 61.1% |
| Scandinavians | 88.2 /100 | #132 | Excellent 61.0% |
| Immigrants | Uzbekistan | 88.0 /100 | #133 | Excellent 61.0% |
| Immigrants | Venezuela | 87.9 /100 | #134 | Excellent 61.0% |
| Immigrants | Uganda | 87.4 /100 | #135 | Excellent 60.9% |
| Basques | 87.2 /100 | #136 | Excellent 60.9% |
| Slovenes | 86.5 /100 | #137 | Excellent 60.9% |
| Taiwanese | 84.3 /100 | #138 | Excellent 60.7% |
| Immigrants | Eritrea | 84.3 /100 | #139 | Excellent 60.7% |
| Iraqis | 83.3 /100 | #140 | Excellent 60.7% |
| Immigrants | Afghanistan | 83.1 /100 | #141 | Excellent 60.7% |
| Poles | 82.8 /100 | #142 | Excellent 60.7% |
| Canadians | 82.7 /100 | #143 | Excellent 60.6% |
| Czechs | 81.9 /100 | #144 | Excellent 60.6% |