Immigrants from Liberia vs Burmese College, 1 year or more
COMPARE
Immigrants from Liberia
Burmese
College, 1 year or more
College, 1 year or more Comparison
Immigrants from Liberia
Burmese
55.7%
COLLEGE, 1 YEAR OR MORE
0.8/ 100
METRIC RATING
245th/ 347
METRIC RANK
66.7%
COLLEGE, 1 YEAR OR MORE
100.0/ 100
METRIC RATING
14th/ 347
METRIC RANK
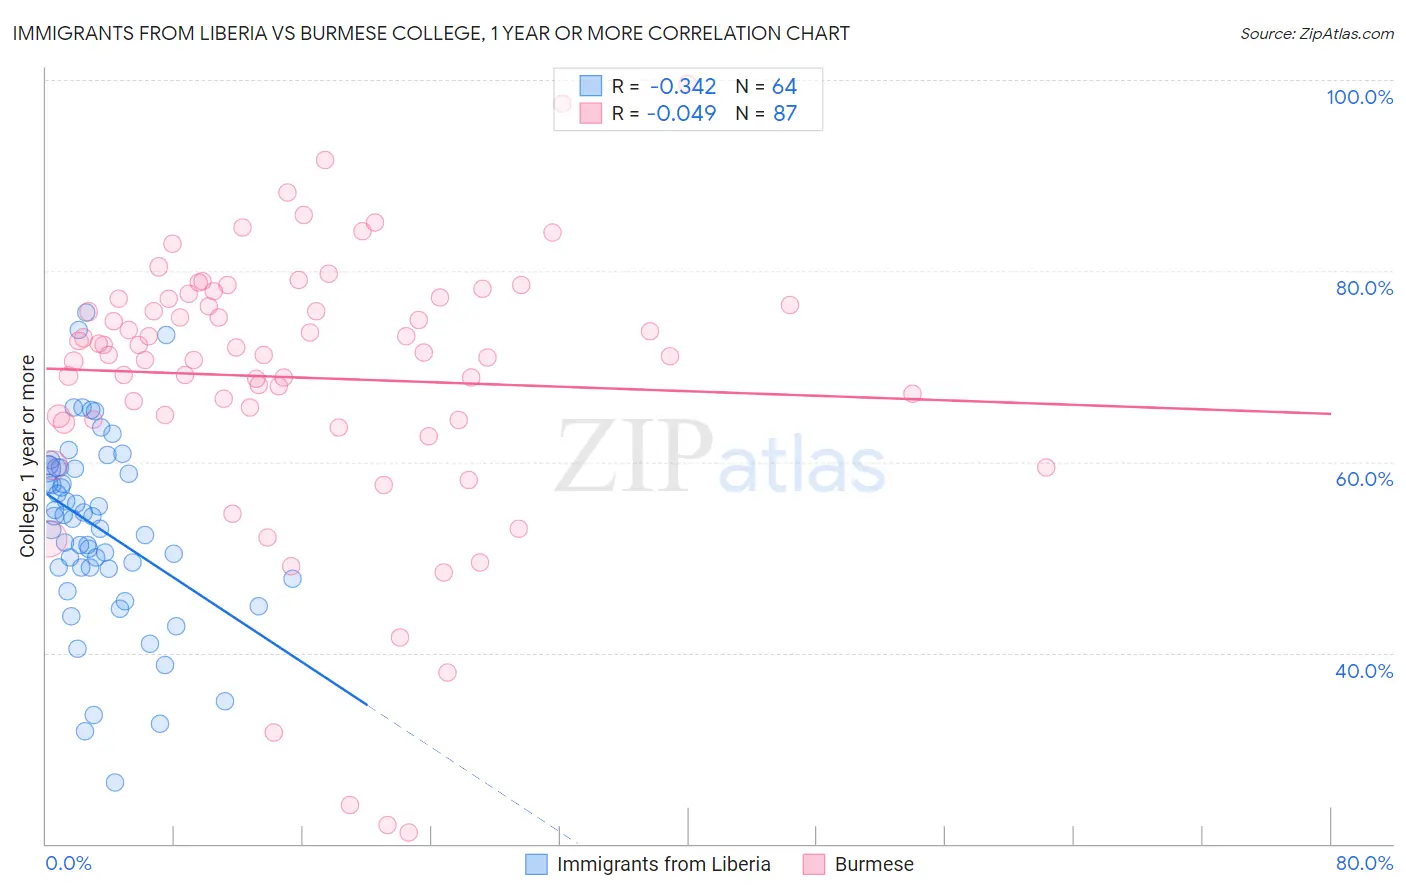
Immigrants from Liberia vs Burmese College, 1 year or more Correlation Chart
The statistical analysis conducted on geographies consisting of 135,295,665 people shows a mild negative correlation between the proportion of Immigrants from Liberia and percentage of population with at least college, 1 year or more education in the United States with a correlation coefficient (R) of -0.342 and weighted average of 55.7%. Similarly, the statistical analysis conducted on geographies consisting of 465,403,137 people shows no correlation between the proportion of Burmese and percentage of population with at least college, 1 year or more education in the United States with a correlation coefficient (R) of -0.049 and weighted average of 66.7%, a difference of 19.9%.
College, 1 year or more Correlation Summary
| Measurement | Immigrants from Liberia | Burmese |
| Minimum | 26.5% | 21.2% |
| Maximum | 75.6% | 99.6% |
| Range | 49.1% | 78.4% |
| Mean | 53.1% | 68.8% |
| Median | 54.2% | 71.4% |
| Interquartile 25% (IQ1) | 48.9% | 64.5% |
| Interquartile 75% (IQ3) | 59.4% | 77.0% |
| Interquartile Range (IQR) | 10.5% | 12.6% |
| Standard Deviation (Sample) | 9.9% | 14.6% |
| Standard Deviation (Population) | 9.8% | 14.5% |
Similar Demographics by College, 1 year or more
Demographics Similar to Immigrants from Liberia by College, 1 year or more
In terms of college, 1 year or more, the demographic groups most similar to Immigrants from Liberia are Malaysian (55.6%, a difference of 0.050%), Chippewa (55.7%, a difference of 0.070%), Hawaiian (55.6%, a difference of 0.12%), Immigrants from Congo (55.6%, a difference of 0.16%), and Osage (55.8%, a difference of 0.19%).
| Demographics | Rating | Rank | College, 1 year or more |
| Barbadians | 1.3 /100 | #238 | Tragic 56.0% |
| Puget Sound Salish | 1.1 /100 | #239 | Tragic 55.9% |
| Trinidadians and Tobagonians | 1.1 /100 | #240 | Tragic 55.8% |
| French American Indians | 1.0 /100 | #241 | Tragic 55.8% |
| Marshallese | 1.0 /100 | #242 | Tragic 55.8% |
| Osage | 1.0 /100 | #243 | Tragic 55.8% |
| Chippewa | 0.9 /100 | #244 | Tragic 55.7% |
| Immigrants | Liberia | 0.8 /100 | #245 | Tragic 55.7% |
| Malaysians | 0.8 /100 | #246 | Tragic 55.6% |
| Hawaiians | 0.8 /100 | #247 | Tragic 55.6% |
| Immigrants | Congo | 0.8 /100 | #248 | Tragic 55.6% |
| Immigrants | Trinidad and Tobago | 0.7 /100 | #249 | Tragic 55.5% |
| Delaware | 0.7 /100 | #250 | Tragic 55.5% |
| Immigrants | Cambodia | 0.6 /100 | #251 | Tragic 55.4% |
| Aleuts | 0.6 /100 | #252 | Tragic 55.4% |
Demographics Similar to Burmese by College, 1 year or more
In terms of college, 1 year or more, the demographic groups most similar to Burmese are Cambodian (66.7%, a difference of 0.0%), Immigrants from Japan (66.7%, a difference of 0.040%), Immigrants from Eastern Asia (66.6%, a difference of 0.15%), Immigrants from Sweden (66.8%, a difference of 0.19%), and Eastern European (66.6%, a difference of 0.22%).
| Demographics | Rating | Rank | College, 1 year or more |
| Okinawans | 100.0 /100 | #7 | Exceptional 69.0% |
| Thais | 100.0 /100 | #8 | Exceptional 68.6% |
| Immigrants | Israel | 100.0 /100 | #9 | Exceptional 67.8% |
| Immigrants | Australia | 100.0 /100 | #10 | Exceptional 67.7% |
| Immigrants | South Central Asia | 100.0 /100 | #11 | Exceptional 67.1% |
| Cypriots | 100.0 /100 | #12 | Exceptional 67.0% |
| Immigrants | Sweden | 100.0 /100 | #13 | Exceptional 66.8% |
| Burmese | 100.0 /100 | #14 | Exceptional 66.7% |
| Cambodians | 100.0 /100 | #15 | Exceptional 66.7% |
| Immigrants | Japan | 100.0 /100 | #16 | Exceptional 66.7% |
| Immigrants | Eastern Asia | 100.0 /100 | #17 | Exceptional 66.6% |
| Eastern Europeans | 100.0 /100 | #18 | Exceptional 66.6% |
| Immigrants | Switzerland | 100.0 /100 | #19 | Exceptional 66.5% |
| Immigrants | Korea | 100.0 /100 | #20 | Exceptional 66.5% |
| Immigrants | Hong Kong | 100.0 /100 | #21 | Exceptional 66.4% |