Immigrants from Liberia vs Mexican Bachelor's Degree
COMPARE
Immigrants from Liberia
Mexican
Bachelor's Degree
Bachelor's Degree Comparison
Immigrants from Liberia
Mexicans
33.5%
BACHELOR'S DEGREE
0.9/ 100
METRIC RATING
249th/ 347
METRIC RANK
27.1%
BACHELOR'S DEGREE
0.0/ 100
METRIC RATING
333rd/ 347
METRIC RANK
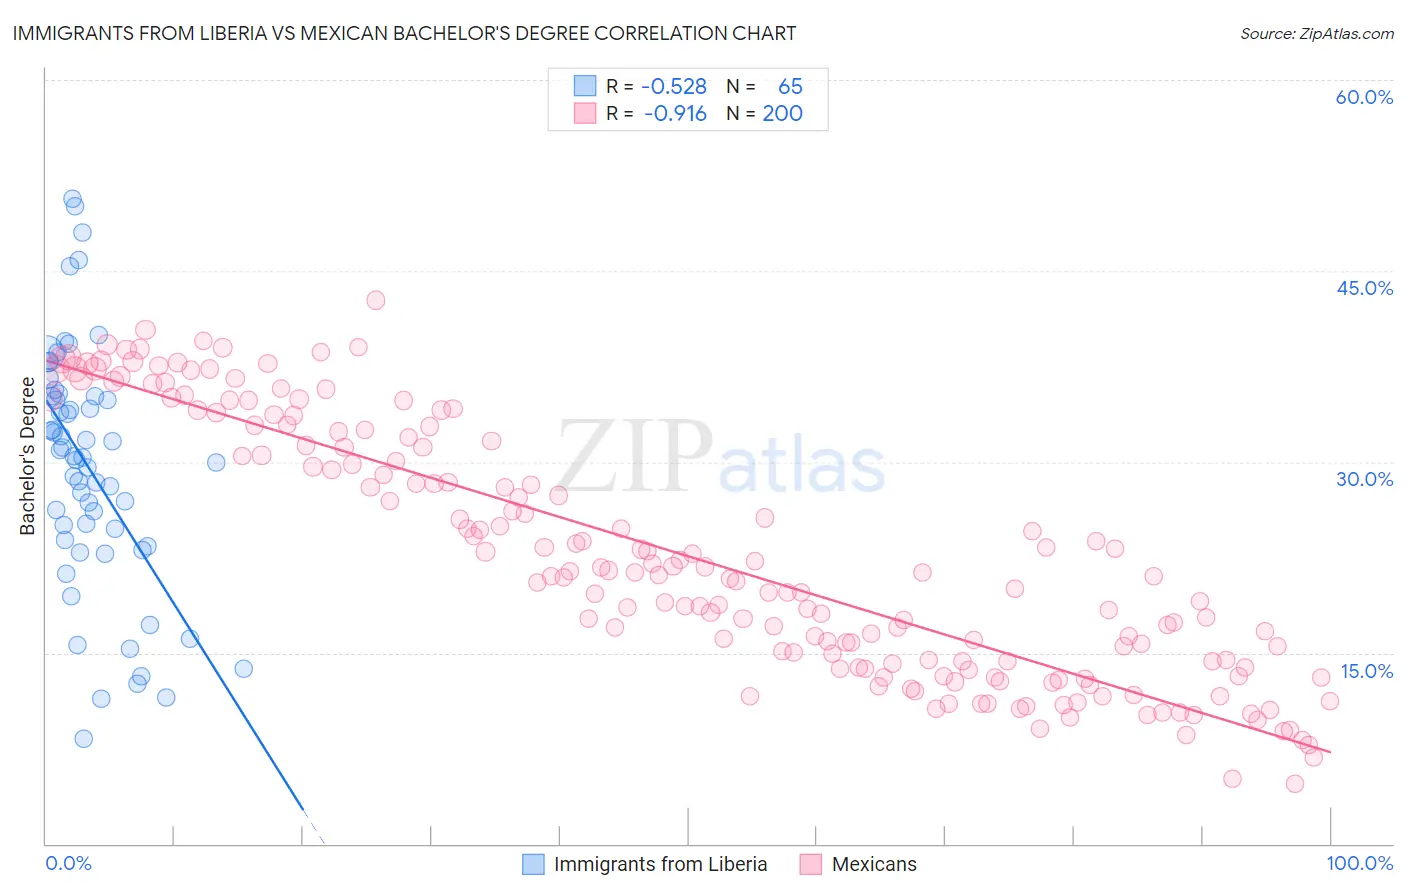
Immigrants from Liberia vs Mexican Bachelor's Degree Correlation Chart
The statistical analysis conducted on geographies consisting of 135,292,805 people shows a substantial negative correlation between the proportion of Immigrants from Liberia and percentage of population with at least bachelor's degree education in the United States with a correlation coefficient (R) of -0.528 and weighted average of 33.5%. Similarly, the statistical analysis conducted on geographies consisting of 565,096,566 people shows a near-perfect negative correlation between the proportion of Mexicans and percentage of population with at least bachelor's degree education in the United States with a correlation coefficient (R) of -0.916 and weighted average of 27.1%, a difference of 23.9%.
Bachelor's Degree Correlation Summary
| Measurement | Immigrants from Liberia | Mexican |
| Minimum | 8.2% | 4.7% |
| Maximum | 50.7% | 42.7% |
| Range | 42.4% | 38.0% |
| Mean | 29.4% | 22.6% |
| Median | 30.3% | 21.0% |
| Interquartile 25% (IQ1) | 23.6% | 14.2% |
| Interquartile 75% (IQ3) | 35.1% | 31.5% |
| Interquartile Range (IQR) | 11.5% | 17.2% |
| Standard Deviation (Sample) | 9.5% | 9.7% |
| Standard Deviation (Population) | 9.5% | 9.7% |
Similar Demographics by Bachelor's Degree
Demographics Similar to Immigrants from Liberia by Bachelor's Degree
In terms of bachelor's degree, the demographic groups most similar to Immigrants from Liberia are Indonesian (33.5%, a difference of 0.010%), Cree (33.6%, a difference of 0.13%), Immigrants from Congo (33.6%, a difference of 0.14%), Jamaican (33.6%, a difference of 0.23%), and Immigrants from Fiji (33.7%, a difference of 0.59%).
| Demographics | Rating | Rank | Bachelor's Degree |
| Immigrants | Nonimmigrants | 1.8 /100 | #242 | Tragic 34.2% |
| Immigrants | Guyana | 1.4 /100 | #243 | Tragic 33.9% |
| Delaware | 1.2 /100 | #244 | Tragic 33.8% |
| Immigrants | Fiji | 1.2 /100 | #245 | Tragic 33.7% |
| Jamaicans | 1.0 /100 | #246 | Tragic 33.6% |
| Immigrants | Congo | 1.0 /100 | #247 | Tragic 33.6% |
| Cree | 1.0 /100 | #248 | Tragic 33.6% |
| Immigrants | Liberia | 0.9 /100 | #249 | Tragic 33.5% |
| Indonesians | 0.9 /100 | #250 | Tragic 33.5% |
| Japanese | 0.7 /100 | #251 | Tragic 33.3% |
| Immigrants | Bahamas | 0.7 /100 | #252 | Tragic 33.3% |
| U.S. Virgin Islanders | 0.7 /100 | #253 | Tragic 33.2% |
| Native Hawaiians | 0.7 /100 | #254 | Tragic 33.2% |
| Iroquois | 0.7 /100 | #255 | Tragic 33.2% |
| Nicaraguans | 0.6 /100 | #256 | Tragic 33.1% |
Demographics Similar to Mexicans by Bachelor's Degree
In terms of bachelor's degree, the demographic groups most similar to Mexicans are Menominee (27.3%, a difference of 0.82%), Immigrants from the Azores (27.3%, a difference of 0.92%), Spanish American Indian (27.5%, a difference of 1.4%), Immigrants from Central America (27.5%, a difference of 1.5%), and Arapaho (26.6%, a difference of 1.7%).
| Demographics | Rating | Rank | Bachelor's Degree |
| Apache | 0.0 /100 | #326 | Tragic 28.3% |
| Paiute | 0.0 /100 | #327 | Tragic 28.1% |
| Crow | 0.0 /100 | #328 | Tragic 27.7% |
| Immigrants | Central America | 0.0 /100 | #329 | Tragic 27.5% |
| Spanish American Indians | 0.0 /100 | #330 | Tragic 27.5% |
| Immigrants | Azores | 0.0 /100 | #331 | Tragic 27.3% |
| Menominee | 0.0 /100 | #332 | Tragic 27.3% |
| Mexicans | 0.0 /100 | #333 | Tragic 27.1% |
| Arapaho | 0.0 /100 | #334 | Tragic 26.6% |
| Natives/Alaskans | 0.0 /100 | #335 | Tragic 26.3% |
| Immigrants | Mexico | 0.0 /100 | #336 | Tragic 26.1% |
| Inupiat | 0.0 /100 | #337 | Tragic 25.8% |
| Pueblo | 0.0 /100 | #338 | Tragic 25.5% |
| Hopi | 0.0 /100 | #339 | Tragic 25.3% |
| Lumbee | 0.0 /100 | #340 | Tragic 24.8% |