Immigrants from Lebanon vs Ethiopian College, Under 1 year
COMPARE
Immigrants from Lebanon
Ethiopian
College, Under 1 year
College, Under 1 year Comparison
Immigrants from Lebanon
Ethiopians
68.3%
COLLEGE, UNDER 1 YEAR
98.3/ 100
METRIC RATING
86th/ 347
METRIC RANK
68.3%
COLLEGE, UNDER 1 YEAR
98.2/ 100
METRIC RATING
89th/ 347
METRIC RANK
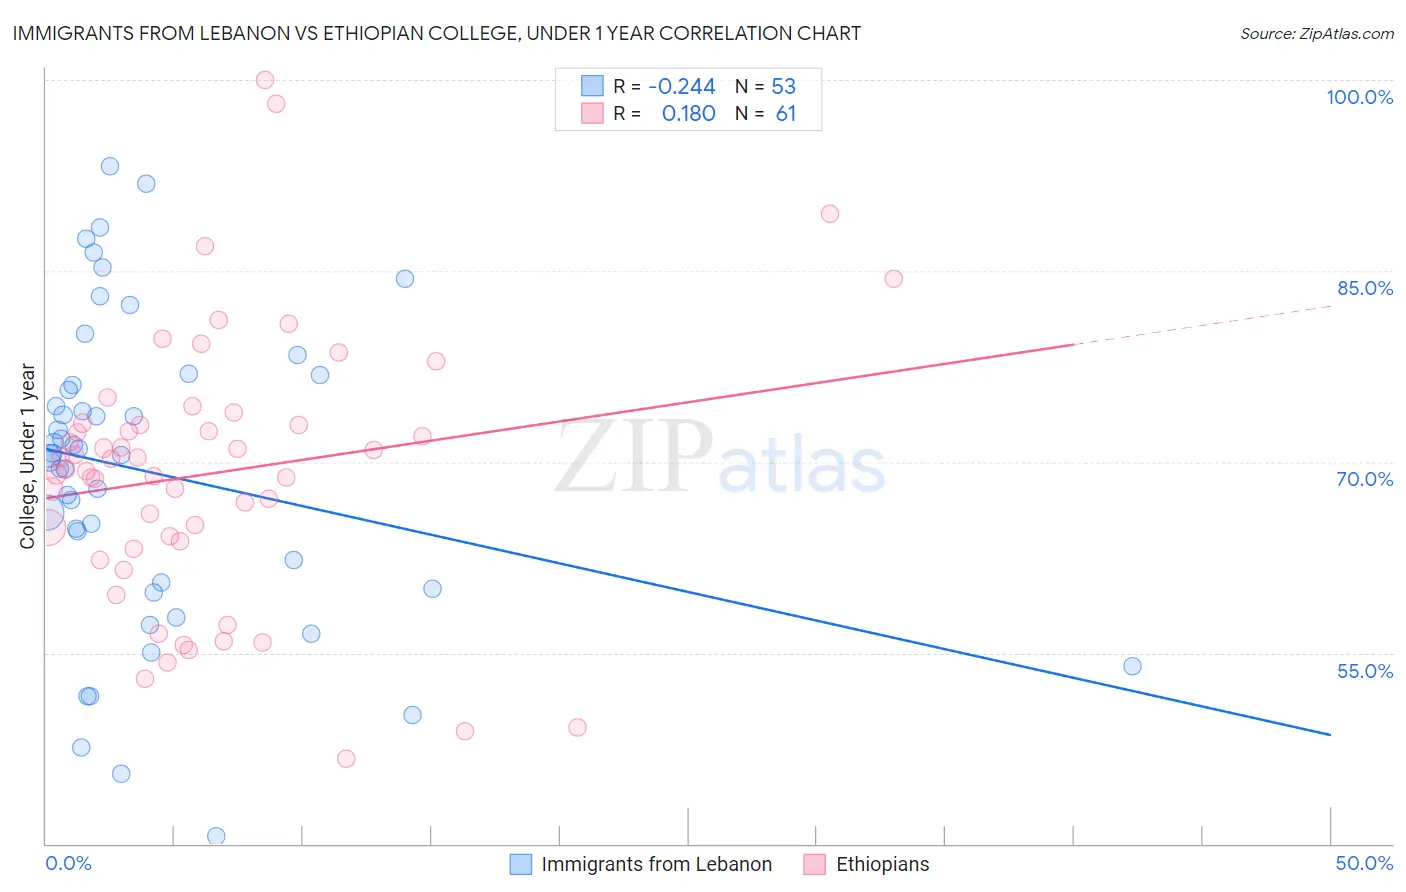
Immigrants from Lebanon vs Ethiopian College, Under 1 year Correlation Chart
The statistical analysis conducted on geographies consisting of 217,164,247 people shows a weak negative correlation between the proportion of Immigrants from Lebanon and percentage of population with at least college, under 1 year education in the United States with a correlation coefficient (R) of -0.244 and weighted average of 68.3%. Similarly, the statistical analysis conducted on geographies consisting of 223,260,030 people shows a poor positive correlation between the proportion of Ethiopians and percentage of population with at least college, under 1 year education in the United States with a correlation coefficient (R) of 0.180 and weighted average of 68.3%, a difference of 0.050%.
College, Under 1 year Correlation Summary
| Measurement | Immigrants from Lebanon | Ethiopian |
| Minimum | 40.6% | 46.6% |
| Maximum | 93.2% | 100.0% |
| Range | 52.6% | 53.4% |
| Mean | 69.2% | 69.1% |
| Median | 70.6% | 69.4% |
| Interquartile 25% (IQ1) | 60.3% | 63.5% |
| Interquartile 75% (IQ3) | 76.5% | 73.0% |
| Interquartile Range (IQR) | 16.1% | 9.5% |
| Standard Deviation (Sample) | 12.1% | 10.6% |
| Standard Deviation (Population) | 12.0% | 10.6% |
Demographics Similar to Immigrants from Lebanon and Ethiopians by College, Under 1 year
In terms of college, under 1 year, the demographic groups most similar to Immigrants from Lebanon are Egyptian (68.3%, a difference of 0.0%), Immigrants from Hungary (68.3%, a difference of 0.010%), Chinese (68.3%, a difference of 0.020%), Argentinean (68.4%, a difference of 0.030%), and Croatian (68.3%, a difference of 0.040%). Similarly, the demographic groups most similar to Ethiopians are Croatian (68.3%, a difference of 0.010%), Chinese (68.3%, a difference of 0.030%), Immigrants from Hungary (68.3%, a difference of 0.060%), Egyptian (68.3%, a difference of 0.060%), and Icelander (68.3%, a difference of 0.060%).
| Demographics | Rating | Rank | College, Under 1 year |
| British | 98.6 /100 | #77 | Exceptional 68.5% |
| Danes | 98.6 /100 | #78 | Exceptional 68.5% |
| Greeks | 98.6 /100 | #79 | Exceptional 68.5% |
| Immigrants | Spain | 98.5 /100 | #80 | Exceptional 68.4% |
| Immigrants | Greece | 98.5 /100 | #81 | Exceptional 68.4% |
| Norwegians | 98.4 /100 | #82 | Exceptional 68.4% |
| Argentineans | 98.4 /100 | #83 | Exceptional 68.4% |
| Immigrants | Hungary | 98.3 /100 | #84 | Exceptional 68.3% |
| Egyptians | 98.3 /100 | #85 | Exceptional 68.3% |
| Immigrants | Lebanon | 98.3 /100 | #86 | Exceptional 68.3% |
| Chinese | 98.3 /100 | #87 | Exceptional 68.3% |
| Croatians | 98.2 /100 | #88 | Exceptional 68.3% |
| Ethiopians | 98.2 /100 | #89 | Exceptional 68.3% |
| Icelanders | 98.1 /100 | #90 | Exceptional 68.3% |
| Europeans | 98.1 /100 | #91 | Exceptional 68.2% |
| Luxembourgers | 98.1 /100 | #92 | Exceptional 68.2% |
| Romanians | 97.9 /100 | #93 | Exceptional 68.2% |
| Armenians | 97.7 /100 | #94 | Exceptional 68.1% |
| Immigrants | Pakistan | 97.5 /100 | #95 | Exceptional 68.0% |
| Jordanians | 97.4 /100 | #96 | Exceptional 68.0% |
| Immigrants | Ethiopia | 97.3 /100 | #97 | Exceptional 68.0% |