Immigrants from China vs Palestinian Nursery School
COMPARE
Immigrants from China
Palestinian
Nursery School
Nursery School Comparison
Immigrants from China
Palestinians
97.5%
NURSERY SCHOOL
0.1/ 100
METRIC RATING
273rd/ 347
METRIC RANK
98.1%
NURSERY SCHOOL
83.7/ 100
METRIC RATING
140th/ 347
METRIC RANK
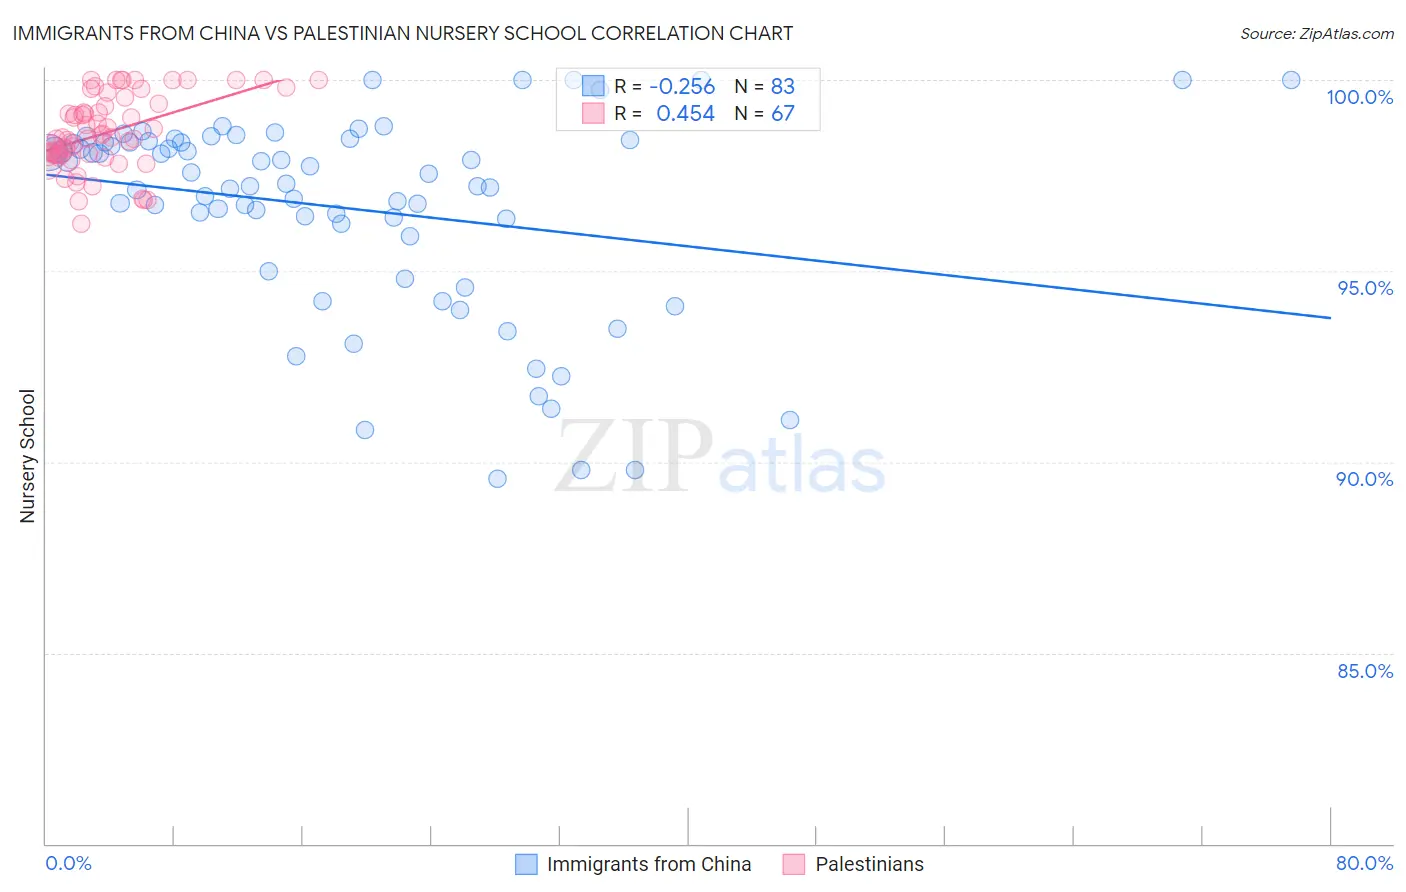
Immigrants from China vs Palestinian Nursery School Correlation Chart
The statistical analysis conducted on geographies consisting of 457,082,957 people shows a weak negative correlation between the proportion of Immigrants from China and percentage of population with at least nursery school education in the United States with a correlation coefficient (R) of -0.256 and weighted average of 97.5%. Similarly, the statistical analysis conducted on geographies consisting of 216,457,008 people shows a moderate positive correlation between the proportion of Palestinians and percentage of population with at least nursery school education in the United States with a correlation coefficient (R) of 0.454 and weighted average of 98.1%, a difference of 0.64%.
Nursery School Correlation Summary
| Measurement | Immigrants from China | Palestinian |
| Minimum | 89.6% | 96.2% |
| Maximum | 100.0% | 100.0% |
| Range | 10.4% | 3.8% |
| Mean | 96.6% | 98.6% |
| Median | 97.3% | 98.5% |
| Interquartile 25% (IQ1) | 95.9% | 98.0% |
| Interquartile 75% (IQ3) | 98.4% | 99.4% |
| Interquartile Range (IQR) | 2.5% | 1.3% |
| Standard Deviation (Sample) | 2.6% | 0.96% |
| Standard Deviation (Population) | 2.6% | 0.95% |
Similar Demographics by Nursery School
Demographics Similar to Immigrants from China by Nursery School
In terms of nursery school, the demographic groups most similar to Immigrants from China are Immigrants from Cameroon (97.5%, a difference of 0.0%), Ghanaian (97.5%, a difference of 0.0%), Immigrants from Bolivia (97.5%, a difference of 0.020%), Immigrants from Philippines (97.5%, a difference of 0.020%), and Immigrants from Western Africa (97.4%, a difference of 0.030%).
| Demographics | Rating | Rank | Nursery School |
| Immigrants | Sierra Leone | 0.3 /100 | #266 | Tragic 97.6% |
| Immigrants | Nigeria | 0.3 /100 | #267 | Tragic 97.5% |
| West Indians | 0.3 /100 | #268 | Tragic 97.5% |
| Immigrants | Liberia | 0.3 /100 | #269 | Tragic 97.5% |
| Immigrants | Jamaica | 0.2 /100 | #270 | Tragic 97.5% |
| Immigrants | Peru | 0.2 /100 | #271 | Tragic 97.5% |
| Immigrants | Bolivia | 0.1 /100 | #272 | Tragic 97.5% |
| Immigrants | China | 0.1 /100 | #273 | Tragic 97.5% |
| Immigrants | Cameroon | 0.1 /100 | #274 | Tragic 97.5% |
| Ghanaians | 0.1 /100 | #275 | Tragic 97.5% |
| Immigrants | Philippines | 0.1 /100 | #276 | Tragic 97.5% |
| Immigrants | Western Africa | 0.1 /100 | #277 | Tragic 97.4% |
| Immigrants | Uzbekistan | 0.1 /100 | #278 | Tragic 97.4% |
| Immigrants | Ghana | 0.1 /100 | #279 | Tragic 97.4% |
| Barbadians | 0.0 /100 | #280 | Tragic 97.4% |
Demographics Similar to Palestinians by Nursery School
In terms of nursery school, the demographic groups most similar to Palestinians are Immigrants from Turkey (98.1%, a difference of 0.0%), Burmese (98.1%, a difference of 0.010%), Marshallese (98.1%, a difference of 0.010%), Blackfeet (98.1%, a difference of 0.020%), and Alsatian (98.1%, a difference of 0.020%).
| Demographics | Rating | Rank | Nursery School |
| Immigrants | Europe | 90.7 /100 | #133 | Exceptional 98.1% |
| Immigrants | Bulgaria | 89.4 /100 | #134 | Excellent 98.1% |
| Immigrants | Hungary | 89.3 /100 | #135 | Excellent 98.1% |
| Immigrants | Kuwait | 88.9 /100 | #136 | Excellent 98.1% |
| Israelis | 88.2 /100 | #137 | Excellent 98.1% |
| Immigrants | Romania | 88.0 /100 | #138 | Excellent 98.1% |
| Blackfeet | 87.5 /100 | #139 | Excellent 98.1% |
| Palestinians | 83.7 /100 | #140 | Excellent 98.1% |
| Immigrants | Turkey | 83.0 /100 | #141 | Excellent 98.1% |
| Burmese | 81.7 /100 | #142 | Excellent 98.1% |
| Marshallese | 81.2 /100 | #143 | Excellent 98.1% |
| Alsatians | 80.3 /100 | #144 | Excellent 98.1% |
| Immigrants | Israel | 78.5 /100 | #145 | Good 98.1% |
| Filipinos | 78.5 /100 | #146 | Good 98.1% |
| Hmong | 75.7 /100 | #147 | Good 98.1% |