Immigrants from Latin America vs Canadian 7th Grade
COMPARE
Immigrants from Latin America
Canadian
7th Grade
7th Grade Comparison
Immigrants from Latin America
Canadians
92.2%
7TH GRADE
0.0/ 100
METRIC RATING
337th/ 347
METRIC RANK
96.9%
7TH GRADE
99.7/ 100
METRIC RATING
65th/ 347
METRIC RANK
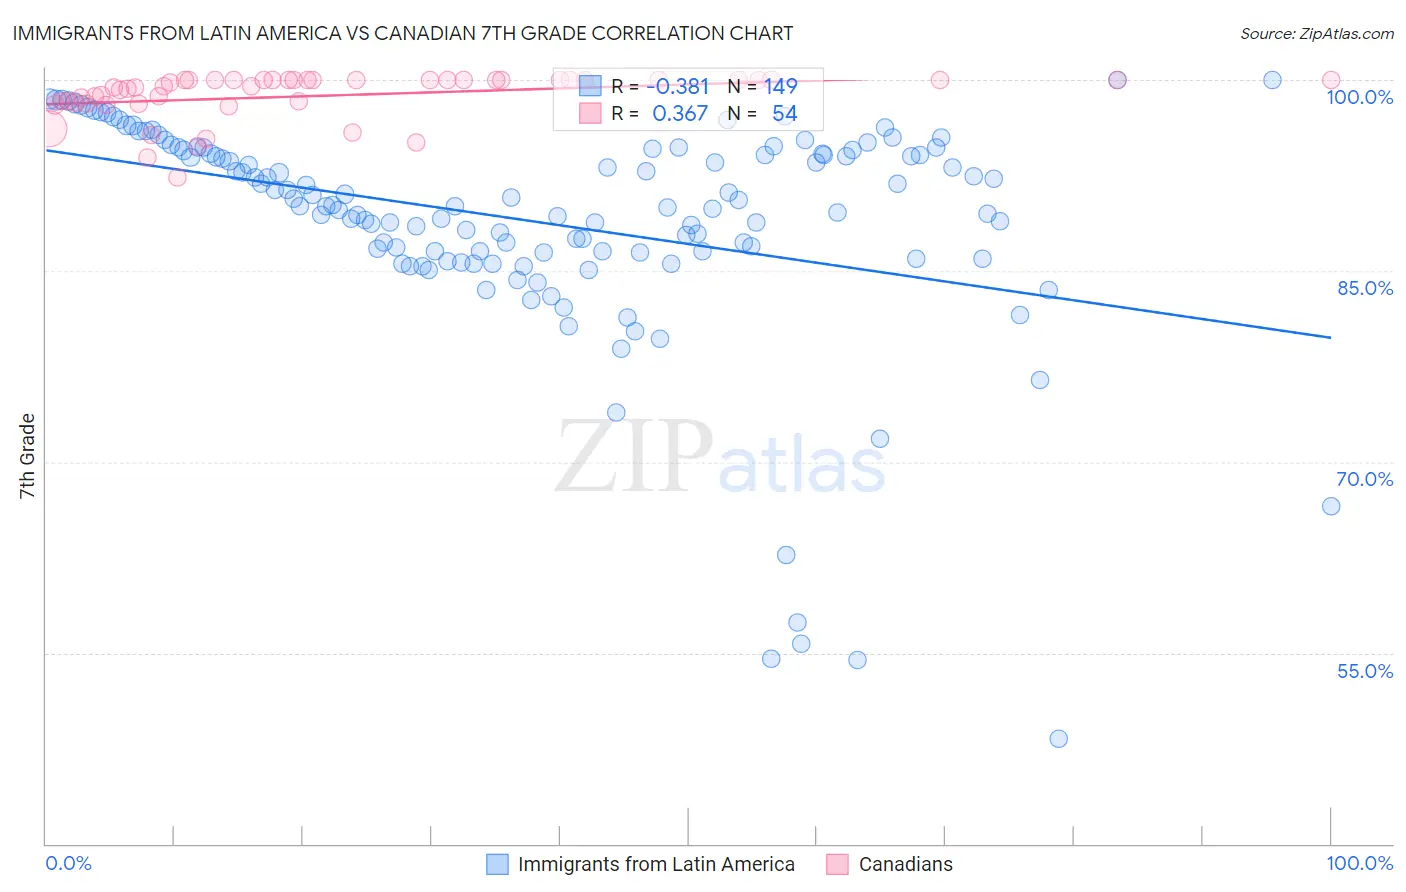
Immigrants from Latin America vs Canadian 7th Grade Correlation Chart
The statistical analysis conducted on geographies consisting of 558,652,041 people shows a mild negative correlation between the proportion of Immigrants from Latin America and percentage of population with at least 7th grade education in the United States with a correlation coefficient (R) of -0.381 and weighted average of 92.2%. Similarly, the statistical analysis conducted on geographies consisting of 437,556,929 people shows a mild positive correlation between the proportion of Canadians and percentage of population with at least 7th grade education in the United States with a correlation coefficient (R) of 0.367 and weighted average of 96.9%, a difference of 5.1%.
7th Grade Correlation Summary
| Measurement | Immigrants from Latin America | Canadian |
| Minimum | 48.3% | 92.3% |
| Maximum | 100.0% | 100.0% |
| Range | 51.7% | 7.7% |
| Mean | 88.9% | 98.8% |
| Median | 90.1% | 99.7% |
| Interquartile 25% (IQ1) | 86.5% | 98.2% |
| Interquartile 75% (IQ3) | 94.5% | 100.0% |
| Interquartile Range (IQR) | 8.0% | 1.8% |
| Standard Deviation (Sample) | 8.9% | 1.8% |
| Standard Deviation (Population) | 8.8% | 1.8% |
Similar Demographics by 7th Grade
Demographics Similar to Immigrants from Latin America by 7th Grade
In terms of 7th grade, the demographic groups most similar to Immigrants from Latin America are Central American (92.1%, a difference of 0.13%), Immigrants from Honduras (92.5%, a difference of 0.27%), Mexican American Indian (92.6%, a difference of 0.34%), Mexican (91.9%, a difference of 0.38%), and Immigrants from Yemen (92.6%, a difference of 0.44%).
| Demographics | Rating | Rank | 7th Grade |
| Immigrants | Dominican Republic | 0.0 /100 | #330 | Tragic 92.9% |
| Hondurans | 0.0 /100 | #331 | Tragic 92.9% |
| Hispanics or Latinos | 0.0 /100 | #332 | Tragic 92.7% |
| Immigrants | Armenia | 0.0 /100 | #333 | Tragic 92.7% |
| Immigrants | Yemen | 0.0 /100 | #334 | Tragic 92.6% |
| Mexican American Indians | 0.0 /100 | #335 | Tragic 92.6% |
| Immigrants | Honduras | 0.0 /100 | #336 | Tragic 92.5% |
| Immigrants | Latin America | 0.0 /100 | #337 | Tragic 92.2% |
| Central Americans | 0.0 /100 | #338 | Tragic 92.1% |
| Mexicans | 0.0 /100 | #339 | Tragic 91.9% |
| Yakama | 0.0 /100 | #340 | Tragic 91.7% |
| Guatemalans | 0.0 /100 | #341 | Tragic 91.7% |
| Salvadorans | 0.0 /100 | #342 | Tragic 91.5% |
| Immigrants | Guatemala | 0.0 /100 | #343 | Tragic 91.3% |
| Immigrants | Central America | 0.0 /100 | #344 | Tragic 91.0% |
Demographics Similar to Canadians by 7th Grade
In terms of 7th grade, the demographic groups most similar to Canadians are Immigrants from Northern Europe (96.9%, a difference of 0.010%), Immigrants from Austria (96.9%, a difference of 0.010%), Ukrainian (96.9%, a difference of 0.020%), Native Hawaiian (96.9%, a difference of 0.020%), and Creek (96.9%, a difference of 0.030%).
| Demographics | Rating | Rank | 7th Grade |
| Whites/Caucasians | 99.8 /100 | #58 | Exceptional 97.0% |
| Macedonians | 99.8 /100 | #59 | Exceptional 97.0% |
| Immigrants | Canada | 99.8 /100 | #60 | Exceptional 96.9% |
| Creek | 99.8 /100 | #61 | Exceptional 96.9% |
| Immigrants | North America | 99.8 /100 | #62 | Exceptional 96.9% |
| Immigrants | Northern Europe | 99.7 /100 | #63 | Exceptional 96.9% |
| Immigrants | Austria | 99.7 /100 | #64 | Exceptional 96.9% |
| Canadians | 99.7 /100 | #65 | Exceptional 96.9% |
| Ukrainians | 99.7 /100 | #66 | Exceptional 96.9% |
| Native Hawaiians | 99.7 /100 | #67 | Exceptional 96.9% |
| Immigrants | India | 99.6 /100 | #68 | Exceptional 96.9% |
| Iranians | 99.6 /100 | #69 | Exceptional 96.8% |
| New Zealanders | 99.6 /100 | #70 | Exceptional 96.8% |
| Immigrants | Lithuania | 99.6 /100 | #71 | Exceptional 96.8% |
| Cajuns | 99.5 /100 | #72 | Exceptional 96.8% |