Immigrants from Laos vs Japanese Nursery School
COMPARE
Immigrants from Laos
Japanese
Nursery School
Nursery School Comparison
Immigrants from Laos
Japanese
96.9%
NURSERY SCHOOL
0.0/ 100
METRIC RATING
319th/ 347
METRIC RANK
96.7%
NURSERY SCHOOL
0.0/ 100
METRIC RATING
330th/ 347
METRIC RANK
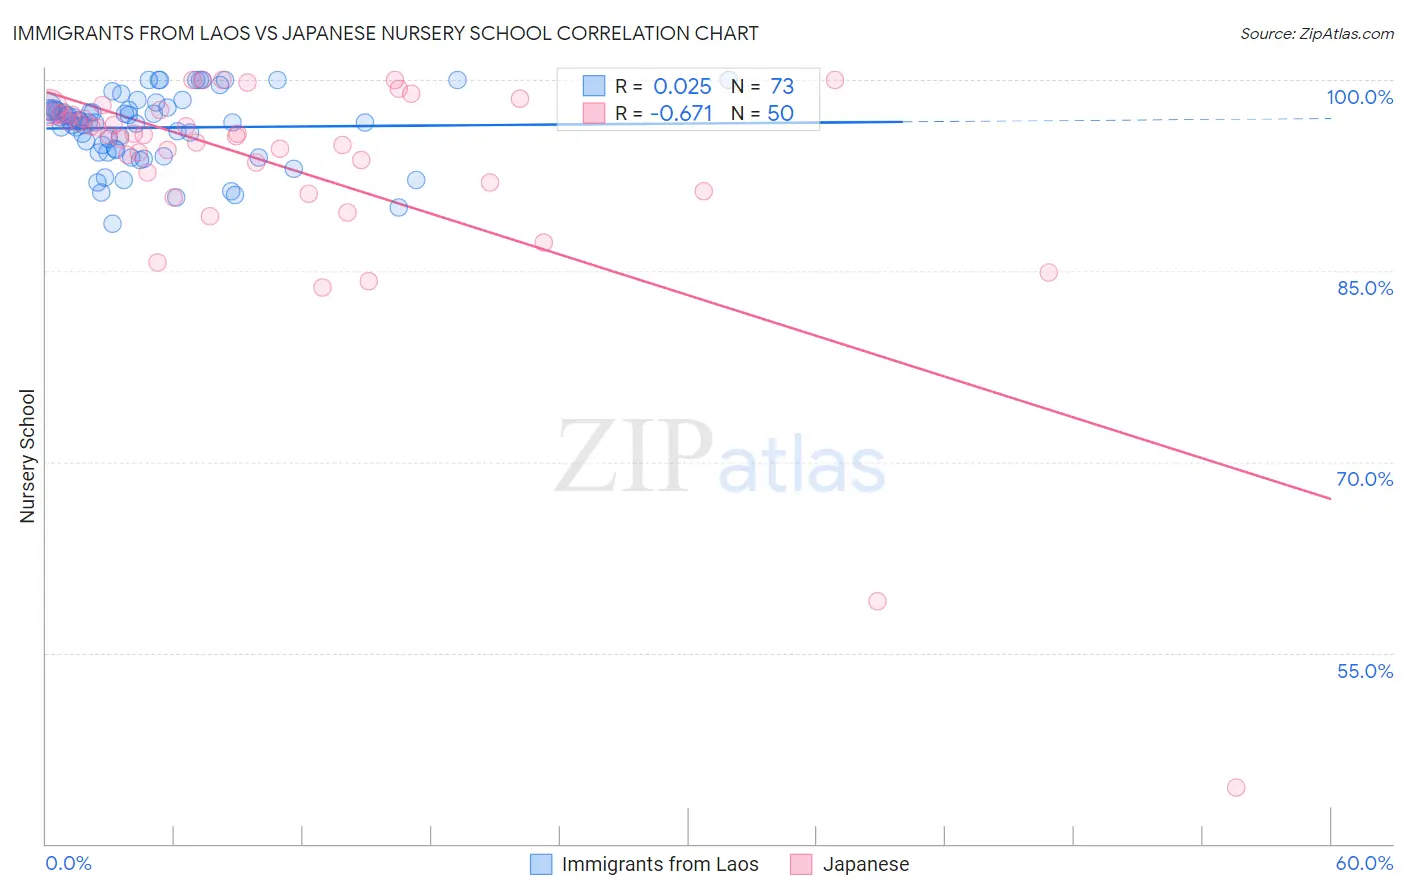
Immigrants from Laos vs Japanese Nursery School Correlation Chart
The statistical analysis conducted on geographies consisting of 201,453,273 people shows no correlation between the proportion of Immigrants from Laos and percentage of population with at least nursery school education in the United States with a correlation coefficient (R) of 0.025 and weighted average of 96.9%. Similarly, the statistical analysis conducted on geographies consisting of 249,183,224 people shows a significant negative correlation between the proportion of Japanese and percentage of population with at least nursery school education in the United States with a correlation coefficient (R) of -0.671 and weighted average of 96.7%, a difference of 0.20%.
Nursery School Correlation Summary
| Measurement | Immigrants from Laos | Japanese |
| Minimum | 88.7% | 44.4% |
| Maximum | 100.0% | 100.0% |
| Range | 11.3% | 55.6% |
| Mean | 96.3% | 93.0% |
| Median | 96.8% | 95.6% |
| Interquartile 25% (IQ1) | 94.4% | 92.0% |
| Interquartile 75% (IQ3) | 97.8% | 97.4% |
| Interquartile Range (IQR) | 3.3% | 5.4% |
| Standard Deviation (Sample) | 2.7% | 9.6% |
| Standard Deviation (Population) | 2.7% | 9.5% |
Demographics Similar to Immigrants from Laos and Japanese by Nursery School
In terms of nursery school, the demographic groups most similar to Immigrants from Laos are Immigrants from Burma/Myanmar (96.9%, a difference of 0.0%), Immigrants from Bangladesh (96.9%, a difference of 0.010%), Immigrants from Guyana (96.9%, a difference of 0.020%), Mexican American Indian (96.9%, a difference of 0.020%), and Immigrants from Honduras (96.9%, a difference of 0.030%). Similarly, the demographic groups most similar to Japanese are Immigrants from Vietnam (96.7%, a difference of 0.010%), Immigrants from Armenia (96.7%, a difference of 0.020%), Yakama (96.6%, a difference of 0.040%), Immigrants from Latin America (96.7%, a difference of 0.060%), and Central American (96.6%, a difference of 0.060%).
| Demographics | Rating | Rank | Nursery School |
| Cape Verdeans | 0.0 /100 | #314 | Tragic 97.0% |
| Immigrants | Nicaragua | 0.0 /100 | #315 | Tragic 96.9% |
| Immigrants | Belize | 0.0 /100 | #316 | Tragic 96.9% |
| Immigrants | Ecuador | 0.0 /100 | #317 | Tragic 96.9% |
| Immigrants | Guyana | 0.0 /100 | #318 | Tragic 96.9% |
| Immigrants | Laos | 0.0 /100 | #319 | Tragic 96.9% |
| Immigrants | Burma/Myanmar | 0.0 /100 | #320 | Tragic 96.9% |
| Immigrants | Bangladesh | 0.0 /100 | #321 | Tragic 96.9% |
| Mexican American Indians | 0.0 /100 | #322 | Tragic 96.9% |
| Immigrants | Honduras | 0.0 /100 | #323 | Tragic 96.9% |
| Vietnamese | 0.0 /100 | #324 | Tragic 96.8% |
| Dominicans | 0.0 /100 | #325 | Tragic 96.8% |
| Indonesians | 0.0 /100 | #326 | Tragic 96.8% |
| Mexicans | 0.0 /100 | #327 | Tragic 96.8% |
| Immigrants | Latin America | 0.0 /100 | #328 | Tragic 96.7% |
| Immigrants | Vietnam | 0.0 /100 | #329 | Tragic 96.7% |
| Japanese | 0.0 /100 | #330 | Tragic 96.7% |
| Immigrants | Armenia | 0.0 /100 | #331 | Tragic 96.7% |
| Yakama | 0.0 /100 | #332 | Tragic 96.6% |
| Central Americans | 0.0 /100 | #333 | Tragic 96.6% |
| Immigrants | Dominican Republic | 0.0 /100 | #334 | Tragic 96.6% |