Immigrants from Laos vs Immigrants from Northern Africa Nursery School
COMPARE
Immigrants from Laos
Immigrants from Northern Africa
Nursery School
Nursery School Comparison
Immigrants from Laos
Immigrants from Northern Africa
96.9%
NURSERY SCHOOL
0.0/ 100
METRIC RATING
319th/ 347
METRIC RANK
97.8%
NURSERY SCHOOL
11.7/ 100
METRIC RATING
208th/ 347
METRIC RANK
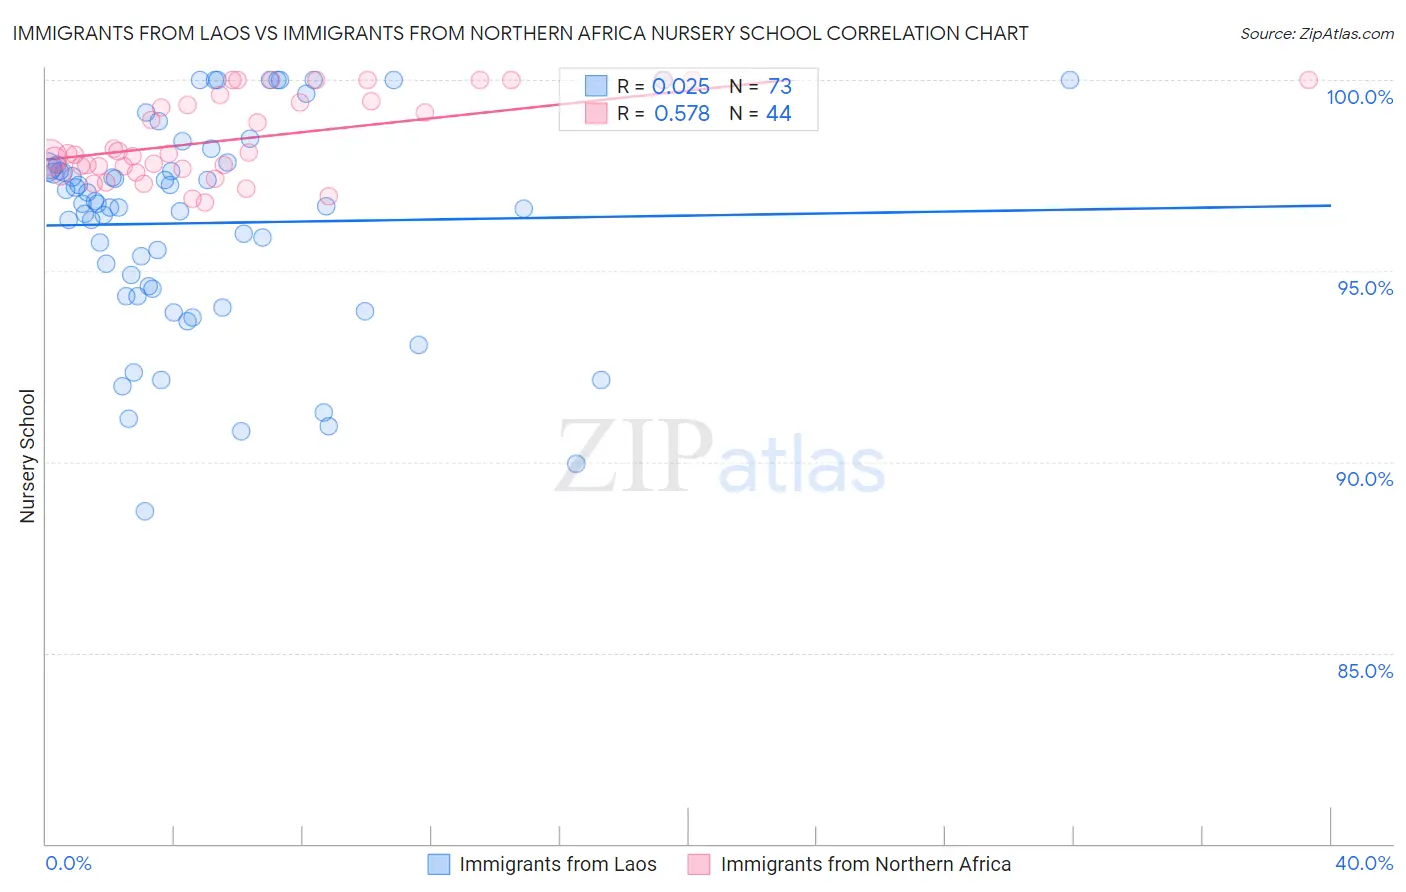
Immigrants from Laos vs Immigrants from Northern Africa Nursery School Correlation Chart
The statistical analysis conducted on geographies consisting of 201,453,273 people shows no correlation between the proportion of Immigrants from Laos and percentage of population with at least nursery school education in the United States with a correlation coefficient (R) of 0.025 and weighted average of 96.9%. Similarly, the statistical analysis conducted on geographies consisting of 321,196,768 people shows a substantial positive correlation between the proportion of Immigrants from Northern Africa and percentage of population with at least nursery school education in the United States with a correlation coefficient (R) of 0.578 and weighted average of 97.8%, a difference of 0.99%.
Nursery School Correlation Summary
| Measurement | Immigrants from Laos | Immigrants from Northern Africa |
| Minimum | 88.7% | 96.8% |
| Maximum | 100.0% | 100.0% |
| Range | 11.3% | 3.2% |
| Mean | 96.3% | 98.5% |
| Median | 96.8% | 98.1% |
| Interquartile 25% (IQ1) | 94.4% | 97.7% |
| Interquartile 75% (IQ3) | 97.8% | 99.5% |
| Interquartile Range (IQR) | 3.3% | 1.8% |
| Standard Deviation (Sample) | 2.7% | 1.1% |
| Standard Deviation (Population) | 2.7% | 1.1% |
Similar Demographics by Nursery School
Demographics Similar to Immigrants from Laos by Nursery School
In terms of nursery school, the demographic groups most similar to Immigrants from Laos are Immigrants from Burma/Myanmar (96.9%, a difference of 0.0%), Immigrants from Bangladesh (96.9%, a difference of 0.010%), Immigrants from Guyana (96.9%, a difference of 0.020%), Mexican American Indian (96.9%, a difference of 0.020%), and Immigrants from Honduras (96.9%, a difference of 0.030%).
| Demographics | Rating | Rank | Nursery School |
| Sri Lankans | 0.0 /100 | #312 | Tragic 97.0% |
| Hondurans | 0.0 /100 | #313 | Tragic 97.0% |
| Cape Verdeans | 0.0 /100 | #314 | Tragic 97.0% |
| Immigrants | Nicaragua | 0.0 /100 | #315 | Tragic 96.9% |
| Immigrants | Belize | 0.0 /100 | #316 | Tragic 96.9% |
| Immigrants | Ecuador | 0.0 /100 | #317 | Tragic 96.9% |
| Immigrants | Guyana | 0.0 /100 | #318 | Tragic 96.9% |
| Immigrants | Laos | 0.0 /100 | #319 | Tragic 96.9% |
| Immigrants | Burma/Myanmar | 0.0 /100 | #320 | Tragic 96.9% |
| Immigrants | Bangladesh | 0.0 /100 | #321 | Tragic 96.9% |
| Mexican American Indians | 0.0 /100 | #322 | Tragic 96.9% |
| Immigrants | Honduras | 0.0 /100 | #323 | Tragic 96.9% |
| Vietnamese | 0.0 /100 | #324 | Tragic 96.8% |
| Dominicans | 0.0 /100 | #325 | Tragic 96.8% |
| Indonesians | 0.0 /100 | #326 | Tragic 96.8% |
Demographics Similar to Immigrants from Northern Africa by Nursery School
In terms of nursery school, the demographic groups most similar to Immigrants from Northern Africa are Costa Rican (97.8%, a difference of 0.0%), Immigrants from Oceania (97.8%, a difference of 0.010%), Laotian (97.8%, a difference of 0.010%), African (97.9%, a difference of 0.020%), and Immigrants from Chile (97.9%, a difference of 0.030%).
| Demographics | Rating | Rank | Nursery School |
| Immigrants | Lebanon | 21.2 /100 | #201 | Fair 97.9% |
| Immigrants | Ukraine | 19.9 /100 | #202 | Poor 97.9% |
| Immigrants | Uganda | 18.0 /100 | #203 | Poor 97.9% |
| Immigrants | Southern Europe | 17.4 /100 | #204 | Poor 97.9% |
| Immigrants | Chile | 17.3 /100 | #205 | Poor 97.9% |
| Immigrants | Albania | 16.4 /100 | #206 | Poor 97.9% |
| Africans | 15.4 /100 | #207 | Poor 97.9% |
| Immigrants | Northern Africa | 11.7 /100 | #208 | Poor 97.8% |
| Costa Ricans | 11.3 /100 | #209 | Poor 97.8% |
| Immigrants | Oceania | 10.2 /100 | #210 | Poor 97.8% |
| Laotians | 9.8 /100 | #211 | Tragic 97.8% |
| Immigrants | Bahamas | 8.6 /100 | #212 | Tragic 97.8% |
| Moroccans | 8.3 /100 | #213 | Tragic 97.8% |
| South American Indians | 8.0 /100 | #214 | Tragic 97.8% |
| Bahamians | 7.4 /100 | #215 | Tragic 97.8% |