Immigrants from Kuwait vs Trinidadian and Tobagonian Kindergarten
COMPARE
Immigrants from Kuwait
Trinidadian and Tobagonian
Kindergarten
Kindergarten Comparison
Immigrants from Kuwait
Trinidadians and Tobagonians
98.1%
KINDERGARTEN
89.2/ 100
METRIC RATING
135th/ 347
METRIC RANK
97.4%
KINDERGARTEN
0.1/ 100
METRIC RATING
281st/ 347
METRIC RANK
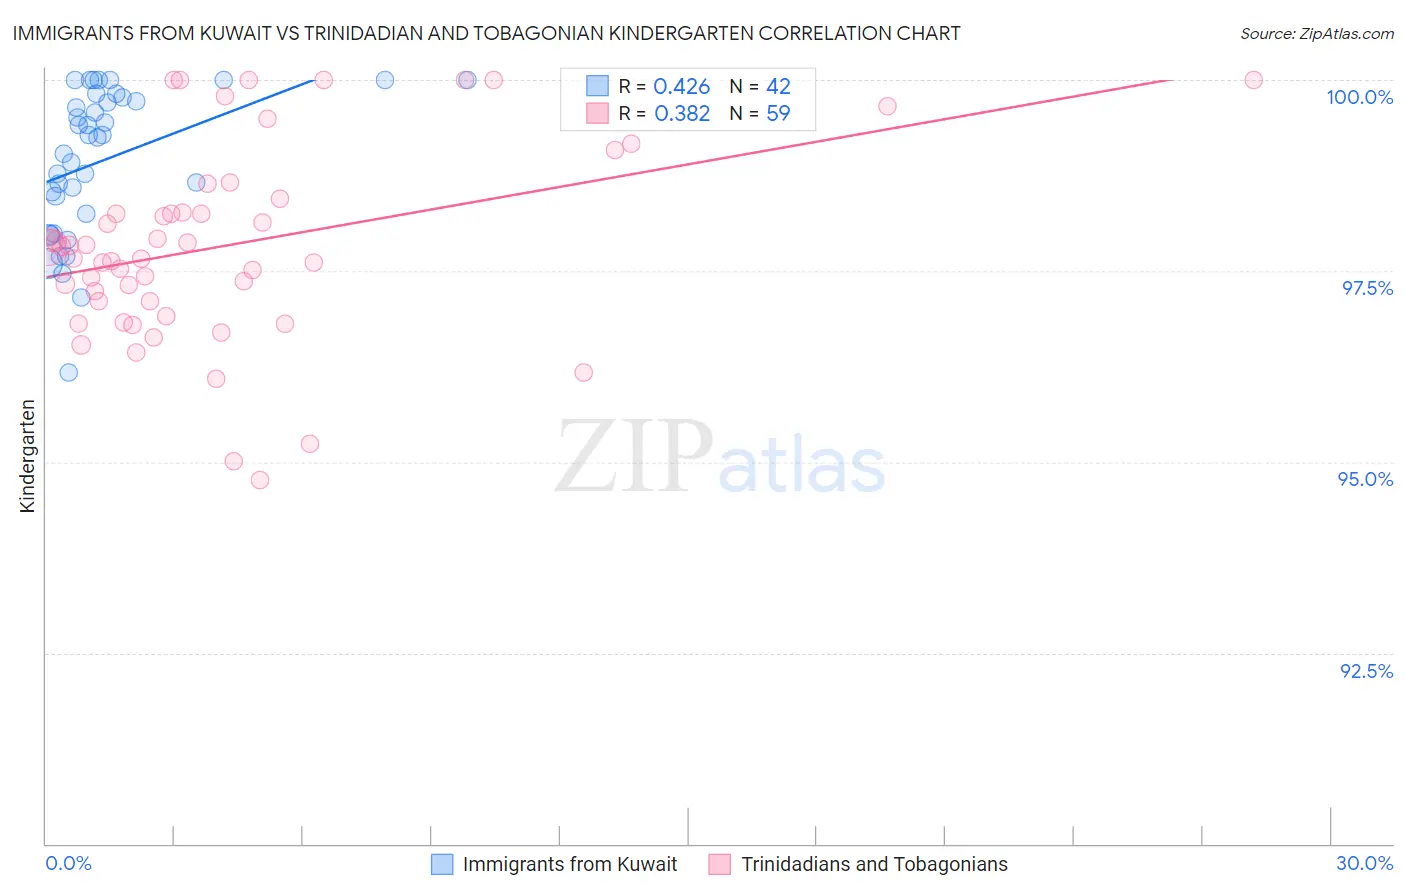
Immigrants from Kuwait vs Trinidadian and Tobagonian Kindergarten Correlation Chart
The statistical analysis conducted on geographies consisting of 136,913,666 people shows a moderate positive correlation between the proportion of Immigrants from Kuwait and percentage of population with at least kindergarten education in the United States with a correlation coefficient (R) of 0.426 and weighted average of 98.1%. Similarly, the statistical analysis conducted on geographies consisting of 219,882,819 people shows a mild positive correlation between the proportion of Trinidadians and Tobagonians and percentage of population with at least kindergarten education in the United States with a correlation coefficient (R) of 0.382 and weighted average of 97.4%, a difference of 0.75%.
Kindergarten Correlation Summary
| Measurement | Immigrants from Kuwait | Trinidadian and Tobagonian |
| Minimum | 96.2% | 94.8% |
| Maximum | 100.0% | 100.0% |
| Range | 3.8% | 5.2% |
| Mean | 98.9% | 97.8% |
| Median | 99.3% | 97.8% |
| Interquartile 25% (IQ1) | 98.2% | 97.1% |
| Interquartile 75% (IQ3) | 99.8% | 98.4% |
| Interquartile Range (IQR) | 1.5% | 1.3% |
| Standard Deviation (Sample) | 0.96% | 1.3% |
| Standard Deviation (Population) | 0.95% | 1.3% |
Similar Demographics by Kindergarten
Demographics Similar to Immigrants from Kuwait by Kindergarten
In terms of kindergarten, the demographic groups most similar to Immigrants from Kuwait are Immigrants from Bulgaria (98.1%, a difference of 0.0%), Immigrants from Hungary (98.1%, a difference of 0.0%), Immigrants from Europe (98.1%, a difference of 0.010%), Blackfeet (98.1%, a difference of 0.010%), and Immigrants from Romania (98.1%, a difference of 0.010%).
| Demographics | Rating | Rank | Kindergarten |
| Immigrants | Serbia | 92.4 /100 | #128 | Exceptional 98.1% |
| Seminole | 91.5 /100 | #129 | Exceptional 98.1% |
| Immigrants | Croatia | 91.2 /100 | #130 | Exceptional 98.1% |
| Cambodians | 91.2 /100 | #131 | Exceptional 98.1% |
| Spaniards | 91.0 /100 | #132 | Exceptional 98.1% |
| Immigrants | Europe | 90.4 /100 | #133 | Exceptional 98.1% |
| Immigrants | Bulgaria | 89.4 /100 | #134 | Excellent 98.1% |
| Immigrants | Kuwait | 89.2 /100 | #135 | Excellent 98.1% |
| Immigrants | Hungary | 89.1 /100 | #136 | Excellent 98.1% |
| Blackfeet | 87.8 /100 | #137 | Excellent 98.1% |
| Immigrants | Romania | 87.7 /100 | #138 | Excellent 98.1% |
| Israelis | 87.7 /100 | #139 | Excellent 98.1% |
| Palestinians | 83.6 /100 | #140 | Excellent 98.1% |
| Marshallese | 83.0 /100 | #141 | Excellent 98.1% |
| Immigrants | Turkey | 82.8 /100 | #142 | Excellent 98.1% |
Demographics Similar to Trinidadians and Tobagonians by Kindergarten
In terms of kindergarten, the demographic groups most similar to Trinidadians and Tobagonians are Barbadian (97.4%, a difference of 0.0%), Immigrants from Uzbekistan (97.4%, a difference of 0.010%), Immigrants from Ghana (97.4%, a difference of 0.010%), Afghan (97.4%, a difference of 0.010%), and Immigrants from Western Africa (97.4%, a difference of 0.030%).
| Demographics | Rating | Rank | Kindergarten |
| Immigrants | Cameroon | 0.1 /100 | #274 | Tragic 97.4% |
| Ghanaians | 0.1 /100 | #275 | Tragic 97.4% |
| Immigrants | Philippines | 0.1 /100 | #276 | Tragic 97.4% |
| Immigrants | Western Africa | 0.1 /100 | #277 | Tragic 97.4% |
| Immigrants | Uzbekistan | 0.1 /100 | #278 | Tragic 97.4% |
| Immigrants | Ghana | 0.1 /100 | #279 | Tragic 97.4% |
| Barbadians | 0.1 /100 | #280 | Tragic 97.4% |
| Trinidadians and Tobagonians | 0.1 /100 | #281 | Tragic 97.4% |
| Afghans | 0.0 /100 | #282 | Tragic 97.4% |
| Immigrants | West Indies | 0.0 /100 | #283 | Tragic 97.3% |
| Immigrants | Trinidad and Tobago | 0.0 /100 | #284 | Tragic 97.3% |
| Immigrants | Portugal | 0.0 /100 | #285 | Tragic 97.3% |
| Immigrants | Barbados | 0.0 /100 | #286 | Tragic 97.3% |
| Immigrants | Hong Kong | 0.0 /100 | #287 | Tragic 97.3% |
| Immigrants | Thailand | 0.0 /100 | #288 | Tragic 97.3% |