Immigrants from Kuwait vs Cheyenne Male Unemployment
COMPARE
Immigrants from Kuwait
Cheyenne
Male Unemployment
Male Unemployment Comparison
Immigrants from Kuwait
Cheyenne
5.1%
MALE UNEMPLOYMENT
93.3/ 100
METRIC RATING
98th/ 347
METRIC RANK
9.8%
MALE UNEMPLOYMENT
0.0/ 100
METRIC RATING
339th/ 347
METRIC RANK
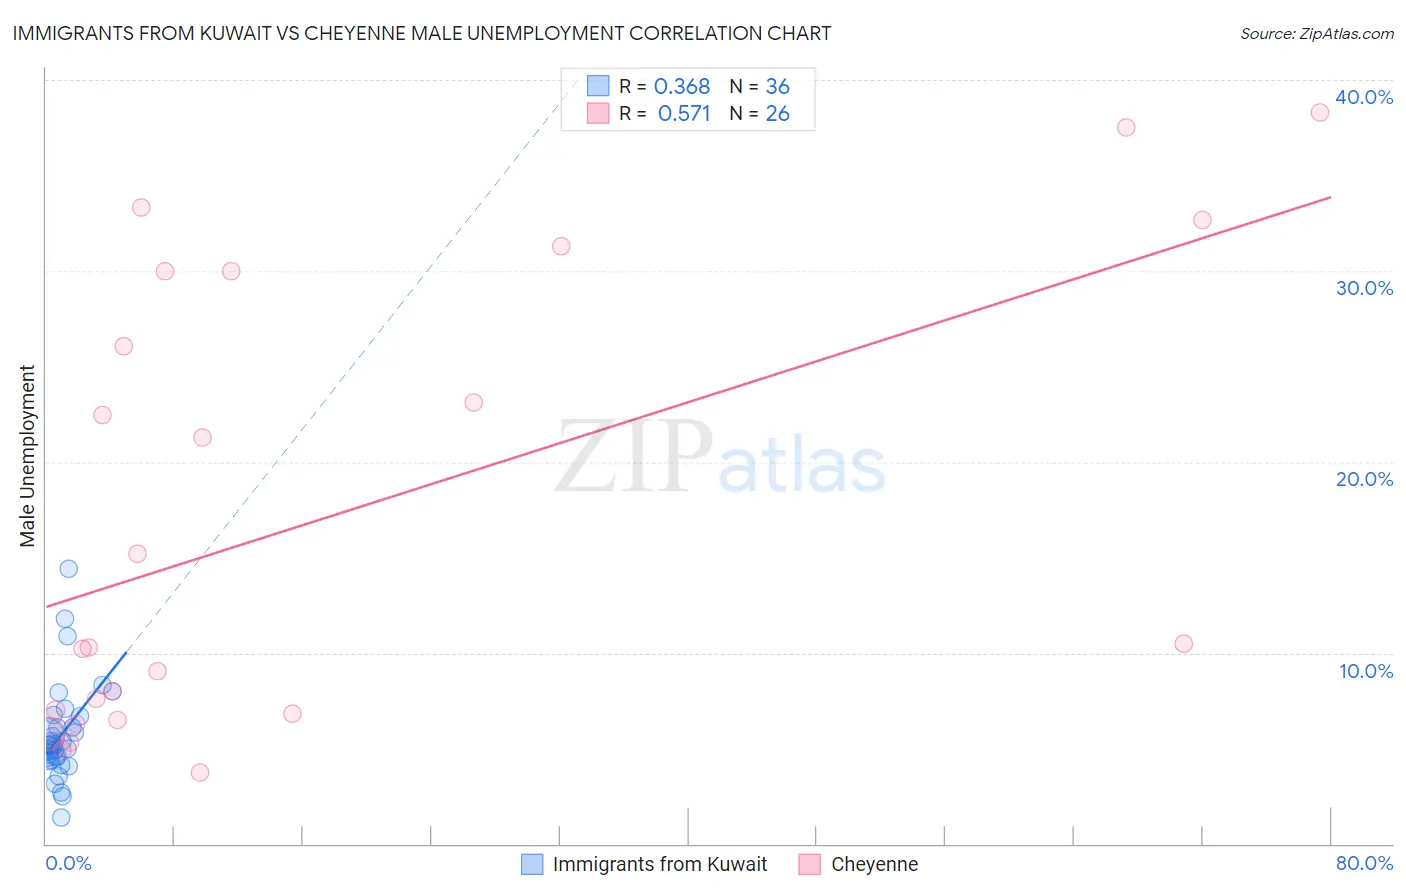
Immigrants from Kuwait vs Cheyenne Male Unemployment Correlation Chart
The statistical analysis conducted on geographies consisting of 136,850,948 people shows a mild positive correlation between the proportion of Immigrants from Kuwait and unemployment rate among males in the United States with a correlation coefficient (R) of 0.368 and weighted average of 5.1%. Similarly, the statistical analysis conducted on geographies consisting of 80,585,658 people shows a substantial positive correlation between the proportion of Cheyenne and unemployment rate among males in the United States with a correlation coefficient (R) of 0.571 and weighted average of 9.8%, a difference of 92.4%.
Male Unemployment Correlation Summary
| Measurement | Immigrants from Kuwait | Cheyenne |
| Minimum | 1.4% | 3.7% |
| Maximum | 14.4% | 38.3% |
| Range | 13.0% | 34.6% |
| Mean | 5.7% | 17.0% |
| Median | 5.1% | 10.4% |
| Interquartile 25% (IQ1) | 4.5% | 6.8% |
| Interquartile 75% (IQ3) | 6.4% | 30.0% |
| Interquartile Range (IQR) | 1.9% | 23.2% |
| Standard Deviation (Sample) | 2.5% | 11.8% |
| Standard Deviation (Population) | 2.5% | 11.6% |
Similar Demographics by Male Unemployment
Demographics Similar to Immigrants from Kuwait by Male Unemployment
In terms of male unemployment, the demographic groups most similar to Immigrants from Kuwait are Immigrants from Spain (5.1%, a difference of 0.040%), Uruguayan (5.1%, a difference of 0.070%), Russian (5.1%, a difference of 0.080%), Asian (5.1%, a difference of 0.11%), and German Russian (5.1%, a difference of 0.12%).
| Demographics | Rating | Rank | Male Unemployment |
| Immigrants | Turkey | 94.4 /100 | #91 | Exceptional 5.1% |
| Slavs | 94.2 /100 | #92 | Exceptional 5.1% |
| Immigrants | Serbia | 94.2 /100 | #93 | Exceptional 5.1% |
| Canadians | 94.1 /100 | #94 | Exceptional 5.1% |
| Italians | 93.8 /100 | #95 | Exceptional 5.1% |
| Asians | 93.7 /100 | #96 | Exceptional 5.1% |
| Immigrants | Spain | 93.4 /100 | #97 | Exceptional 5.1% |
| Immigrants | Kuwait | 93.3 /100 | #98 | Exceptional 5.1% |
| Uruguayans | 93.0 /100 | #99 | Exceptional 5.1% |
| Russians | 92.9 /100 | #100 | Exceptional 5.1% |
| German Russians | 92.7 /100 | #101 | Exceptional 5.1% |
| Immigrants | France | 92.7 /100 | #102 | Exceptional 5.1% |
| Immigrants | Jordan | 91.9 /100 | #103 | Exceptional 5.1% |
| Immigrants | Chile | 91.8 /100 | #104 | Exceptional 5.1% |
| Immigrants | Czechoslovakia | 91.7 /100 | #105 | Exceptional 5.1% |
Demographics Similar to Cheyenne by Male Unemployment
In terms of male unemployment, the demographic groups most similar to Cheyenne are Alaskan Athabascan (9.8%, a difference of 0.080%), Navajo (9.8%, a difference of 0.36%), Tohono O'odham (10.2%, a difference of 3.8%), Crow (10.6%, a difference of 8.3%), and Hopi (10.8%, a difference of 10.1%).
| Demographics | Rating | Rank | Male Unemployment |
| Pima | 0.0 /100 | #332 | Tragic 8.3% |
| Sioux | 0.0 /100 | #333 | Tragic 8.4% |
| Tsimshian | 0.0 /100 | #334 | Tragic 8.5% |
| Pueblo | 0.0 /100 | #335 | Tragic 8.5% |
| Yuman | 0.0 /100 | #336 | Tragic 8.6% |
| Puerto Ricans | 0.0 /100 | #337 | Tragic 8.6% |
| Apache | 0.0 /100 | #338 | Tragic 8.6% |
| Cheyenne | 0.0 /100 | #339 | Tragic 9.8% |
| Alaskan Athabascans | 0.0 /100 | #340 | Tragic 9.8% |
| Navajo | 0.0 /100 | #341 | Tragic 9.8% |
| Tohono O'odham | 0.0 /100 | #342 | Tragic 10.2% |
| Crow | 0.0 /100 | #343 | Tragic 10.6% |
| Hopi | 0.0 /100 | #344 | Tragic 10.8% |
| Arapaho | 0.0 /100 | #345 | Tragic 11.0% |
| Inupiat | 0.0 /100 | #346 | Tragic 12.1% |