Immigrants from Kuwait vs Aleut 9th Grade
COMPARE
Immigrants from Kuwait
Aleut
9th Grade
9th Grade Comparison
Immigrants from Kuwait
Aleuts
95.4%
9TH GRADE
95.5/ 100
METRIC RATING
122nd/ 347
METRIC RANK
96.0%
9TH GRADE
99.8/ 100
METRIC RATING
58th/ 347
METRIC RANK
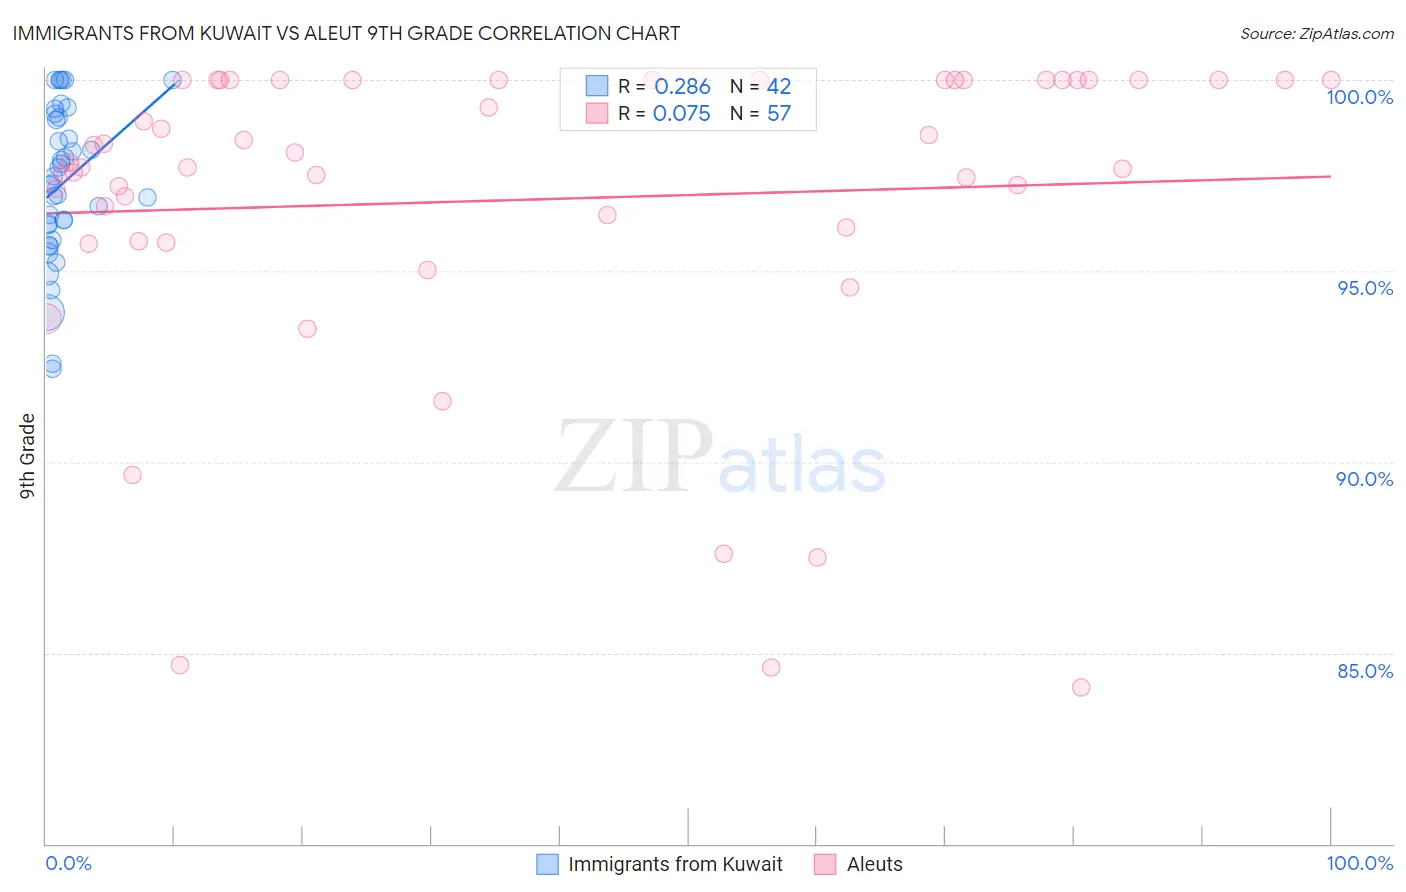
Immigrants from Kuwait vs Aleut 9th Grade Correlation Chart
The statistical analysis conducted on geographies consisting of 136,913,666 people shows a weak positive correlation between the proportion of Immigrants from Kuwait and percentage of population with at least 9th grade education in the United States with a correlation coefficient (R) of 0.286 and weighted average of 95.4%. Similarly, the statistical analysis conducted on geographies consisting of 61,782,786 people shows a slight positive correlation between the proportion of Aleuts and percentage of population with at least 9th grade education in the United States with a correlation coefficient (R) of 0.075 and weighted average of 96.0%, a difference of 0.58%.
9th Grade Correlation Summary
| Measurement | Immigrants from Kuwait | Aleut |
| Minimum | 92.5% | 84.1% |
| Maximum | 100.0% | 100.0% |
| Range | 7.5% | 15.9% |
| Mean | 97.3% | 96.9% |
| Median | 97.4% | 97.8% |
| Interquartile 25% (IQ1) | 96.2% | 96.0% |
| Interquartile 75% (IQ3) | 99.0% | 100.0% |
| Interquartile Range (IQR) | 2.8% | 4.0% |
| Standard Deviation (Sample) | 2.0% | 4.2% |
| Standard Deviation (Population) | 2.0% | 4.1% |
Similar Demographics by 9th Grade
Demographics Similar to Immigrants from Kuwait by 9th Grade
In terms of 9th grade, the demographic groups most similar to Immigrants from Kuwait are Immigrants from Romania (95.4%, a difference of 0.0%), Immigrants from Turkey (95.4%, a difference of 0.0%), Soviet Union (95.4%, a difference of 0.0%), Cambodian (95.4%, a difference of 0.0%), and Cree (95.4%, a difference of 0.0%).
| Demographics | Rating | Rank | 9th Grade |
| Burmese | 96.0 /100 | #115 | Exceptional 95.4% |
| Immigrants | Europe | 95.7 /100 | #116 | Exceptional 95.4% |
| Immigrants | Romania | 95.6 /100 | #117 | Exceptional 95.4% |
| Immigrants | Turkey | 95.6 /100 | #118 | Exceptional 95.4% |
| Soviet Union | 95.6 /100 | #119 | Exceptional 95.4% |
| Cambodians | 95.6 /100 | #120 | Exceptional 95.4% |
| Cree | 95.5 /100 | #121 | Exceptional 95.4% |
| Immigrants | Kuwait | 95.5 /100 | #122 | Exceptional 95.4% |
| Kiowa | 95.3 /100 | #123 | Exceptional 95.4% |
| Shoshone | 95.3 /100 | #124 | Exceptional 95.4% |
| Immigrants | South Central Asia | 95.1 /100 | #125 | Exceptional 95.4% |
| Immigrants | Serbia | 94.4 /100 | #126 | Exceptional 95.4% |
| Palestinians | 94.3 /100 | #127 | Exceptional 95.4% |
| Immigrants | Hungary | 94.2 /100 | #128 | Exceptional 95.4% |
| Basques | 94.1 /100 | #129 | Exceptional 95.4% |
Demographics Similar to Aleuts by 9th Grade
In terms of 9th grade, the demographic groups most similar to Aleuts are Macedonian (96.0%, a difference of 0.0%), Immigrants from Austria (96.0%, a difference of 0.010%), Immigrants from North America (96.0%, a difference of 0.010%), New Zealander (95.9%, a difference of 0.020%), and Immigrants from Canada (96.0%, a difference of 0.030%).
| Demographics | Rating | Rank | 9th Grade |
| Immigrants | Northern Europe | 99.9 /100 | #51 | Exceptional 96.0% |
| Serbians | 99.9 /100 | #52 | Exceptional 96.0% |
| Austrians | 99.8 /100 | #53 | Exceptional 96.0% |
| Immigrants | Canada | 99.8 /100 | #54 | Exceptional 96.0% |
| Immigrants | Austria | 99.8 /100 | #55 | Exceptional 96.0% |
| Immigrants | North America | 99.8 /100 | #56 | Exceptional 96.0% |
| Macedonians | 99.8 /100 | #57 | Exceptional 96.0% |
| Aleuts | 99.8 /100 | #58 | Exceptional 96.0% |
| New Zealanders | 99.8 /100 | #59 | Exceptional 95.9% |
| Native Hawaiians | 99.8 /100 | #60 | Exceptional 95.9% |
| Sioux | 99.8 /100 | #61 | Exceptional 95.9% |
| Ukrainians | 99.7 /100 | #62 | Exceptional 95.9% |
| Canadians | 99.7 /100 | #63 | Exceptional 95.9% |
| Zimbabweans | 99.7 /100 | #64 | Exceptional 95.9% |
| Immigrants | England | 99.6 /100 | #65 | Exceptional 95.9% |