Immigrants from Kuwait vs Hmong 9th Grade
COMPARE
Immigrants from Kuwait
Hmong
9th Grade
9th Grade Comparison
Immigrants from Kuwait
Hmong
95.4%
9TH GRADE
95.5/ 100
METRIC RATING
122nd/ 347
METRIC RANK
95.2%
9TH GRADE
87.7/ 100
METRIC RATING
137th/ 347
METRIC RANK
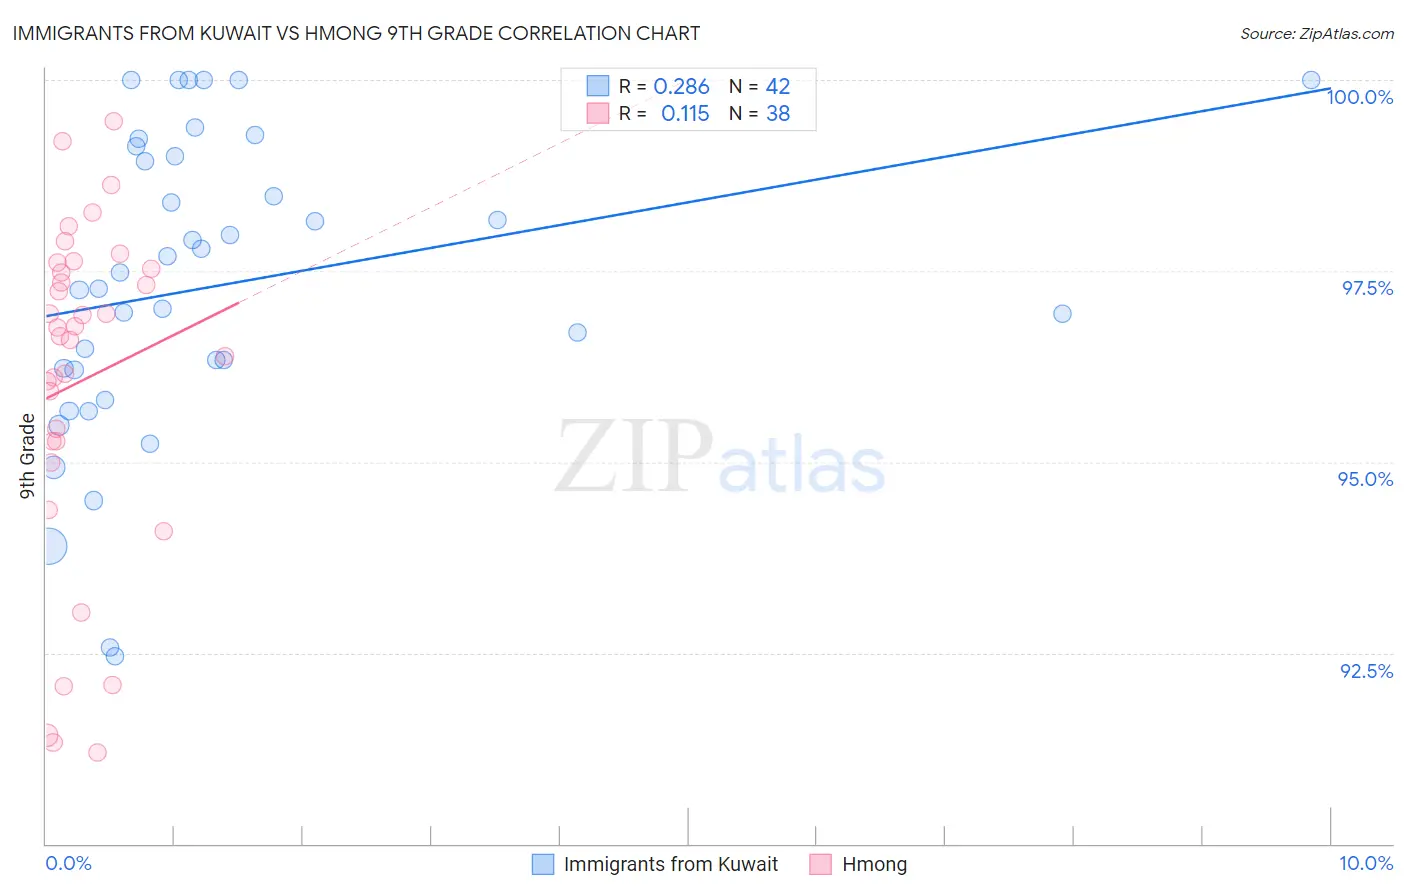
Immigrants from Kuwait vs Hmong 9th Grade Correlation Chart
The statistical analysis conducted on geographies consisting of 136,913,666 people shows a weak positive correlation between the proportion of Immigrants from Kuwait and percentage of population with at least 9th grade education in the United States with a correlation coefficient (R) of 0.286 and weighted average of 95.4%. Similarly, the statistical analysis conducted on geographies consisting of 24,672,093 people shows a poor positive correlation between the proportion of Hmong and percentage of population with at least 9th grade education in the United States with a correlation coefficient (R) of 0.115 and weighted average of 95.2%, a difference of 0.20%.
9th Grade Correlation Summary
| Measurement | Immigrants from Kuwait | Hmong |
| Minimum | 92.5% | 91.2% |
| Maximum | 100.0% | 99.5% |
| Range | 7.5% | 8.3% |
| Mean | 97.3% | 96.1% |
| Median | 97.4% | 96.7% |
| Interquartile 25% (IQ1) | 96.2% | 95.3% |
| Interquartile 75% (IQ3) | 99.0% | 97.5% |
| Interquartile Range (IQR) | 2.8% | 2.3% |
| Standard Deviation (Sample) | 2.0% | 2.2% |
| Standard Deviation (Population) | 2.0% | 2.2% |
Demographics Similar to Immigrants from Kuwait and Hmong by 9th Grade
In terms of 9th grade, the demographic groups most similar to Immigrants from Kuwait are Soviet Union (95.4%, a difference of 0.0%), Cambodian (95.4%, a difference of 0.0%), Cree (95.4%, a difference of 0.0%), Kiowa (95.4%, a difference of 0.010%), and Shoshone (95.4%, a difference of 0.010%). Similarly, the demographic groups most similar to Hmong are Immigrants from Iran (95.2%, a difference of 0.010%), Immigrants from Belarus (95.2%, a difference of 0.020%), Immigrants from Russia (95.2%, a difference of 0.020%), Immigrants from Eastern Europe (95.2%, a difference of 0.030%), and Immigrants from Israel (95.3%, a difference of 0.040%).
| Demographics | Rating | Rank | 9th Grade |
| Soviet Union | 95.6 /100 | #119 | Exceptional 95.4% |
| Cambodians | 95.6 /100 | #120 | Exceptional 95.4% |
| Cree | 95.5 /100 | #121 | Exceptional 95.4% |
| Immigrants | Kuwait | 95.5 /100 | #122 | Exceptional 95.4% |
| Kiowa | 95.3 /100 | #123 | Exceptional 95.4% |
| Shoshone | 95.3 /100 | #124 | Exceptional 95.4% |
| Immigrants | South Central Asia | 95.1 /100 | #125 | Exceptional 95.4% |
| Immigrants | Serbia | 94.4 /100 | #126 | Exceptional 95.4% |
| Palestinians | 94.3 /100 | #127 | Exceptional 95.4% |
| Immigrants | Hungary | 94.2 /100 | #128 | Exceptional 95.4% |
| Basques | 94.1 /100 | #129 | Exceptional 95.4% |
| Jordanians | 93.5 /100 | #130 | Exceptional 95.3% |
| Immigrants | North Macedonia | 92.3 /100 | #131 | Exceptional 95.3% |
| Immigrants | Nonimmigrants | 92.0 /100 | #132 | Exceptional 95.3% |
| Israelis | 90.4 /100 | #133 | Exceptional 95.3% |
| Immigrants | Israel | 89.6 /100 | #134 | Excellent 95.3% |
| Immigrants | Belarus | 88.9 /100 | #135 | Excellent 95.2% |
| Immigrants | Iran | 88.3 /100 | #136 | Excellent 95.2% |
| Hmong | 87.7 /100 | #137 | Excellent 95.2% |
| Immigrants | Russia | 86.6 /100 | #138 | Excellent 95.2% |
| Immigrants | Eastern Europe | 85.8 /100 | #139 | Excellent 95.2% |