Immigrants from Korea vs Slovene 5th Grade
COMPARE
Immigrants from Korea
Slovene
5th Grade
5th Grade Comparison
Immigrants from Korea
Slovenes
97.3%
5TH GRADE
54.1/ 100
METRIC RATING
169th/ 347
METRIC RANK
98.3%
5TH GRADE
100.0/ 100
METRIC RATING
8th/ 347
METRIC RANK
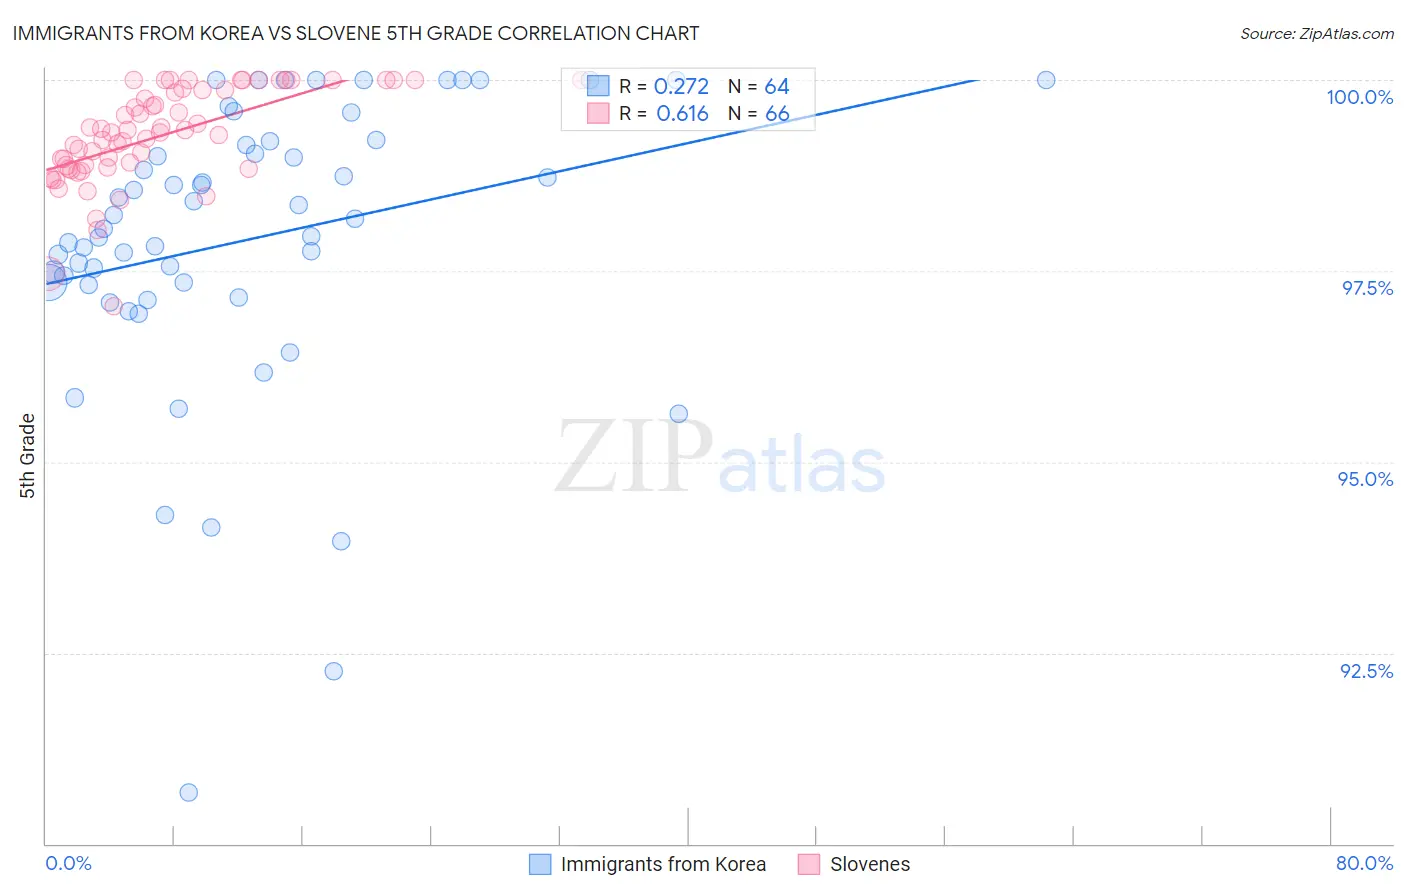
Immigrants from Korea vs Slovene 5th Grade Correlation Chart
The statistical analysis conducted on geographies consisting of 416,280,076 people shows a weak positive correlation between the proportion of Immigrants from Korea and percentage of population with at least 5th grade education in the United States with a correlation coefficient (R) of 0.272 and weighted average of 97.3%. Similarly, the statistical analysis conducted on geographies consisting of 261,353,374 people shows a significant positive correlation between the proportion of Slovenes and percentage of population with at least 5th grade education in the United States with a correlation coefficient (R) of 0.616 and weighted average of 98.3%, a difference of 1.0%.
5th Grade Correlation Summary
| Measurement | Immigrants from Korea | Slovene |
| Minimum | 90.7% | 97.0% |
| Maximum | 100.0% | 100.0% |
| Range | 9.3% | 3.0% |
| Mean | 97.9% | 99.3% |
| Median | 98.1% | 99.3% |
| Interquartile 25% (IQ1) | 97.3% | 98.9% |
| Interquartile 75% (IQ3) | 99.2% | 99.9% |
| Interquartile Range (IQR) | 1.8% | 1.0% |
| Standard Deviation (Sample) | 1.9% | 0.64% |
| Standard Deviation (Population) | 1.9% | 0.64% |
Similar Demographics by 5th Grade
Demographics Similar to Immigrants from Korea by 5th Grade
In terms of 5th grade, the demographic groups most similar to Immigrants from Korea are Immigrants from Belarus (97.3%, a difference of 0.0%), Chilean (97.3%, a difference of 0.0%), Venezuelan (97.3%, a difference of 0.0%), Immigrants from Sri Lanka (97.3%, a difference of 0.0%), and Arab (97.3%, a difference of 0.0%).
| Demographics | Rating | Rank | 5th Grade |
| Immigrants | Iran | 59.5 /100 | #162 | Average 97.4% |
| Ugandans | 58.9 /100 | #163 | Average 97.4% |
| Bermudans | 58.8 /100 | #164 | Average 97.4% |
| Immigrants | Poland | 57.9 /100 | #165 | Average 97.4% |
| Apache | 57.2 /100 | #166 | Average 97.4% |
| Immigrants | Belarus | 54.6 /100 | #167 | Average 97.3% |
| Chileans | 54.5 /100 | #168 | Average 97.3% |
| Immigrants | Korea | 54.1 /100 | #169 | Average 97.3% |
| Venezuelans | 54.0 /100 | #170 | Average 97.3% |
| Immigrants | Sri Lanka | 53.8 /100 | #171 | Average 97.3% |
| Arabs | 53.4 /100 | #172 | Average 97.3% |
| Egyptians | 52.4 /100 | #173 | Average 97.3% |
| Immigrants | Kazakhstan | 50.0 /100 | #174 | Average 97.3% |
| Immigrants | Micronesia | 48.8 /100 | #175 | Average 97.3% |
| Immigrants | Taiwan | 48.4 /100 | #176 | Average 97.3% |
Demographics Similar to Slovenes by 5th Grade
In terms of 5th grade, the demographic groups most similar to Slovenes are Inupiat (98.4%, a difference of 0.020%), Swedish (98.3%, a difference of 0.040%), English (98.3%, a difference of 0.040%), Alaskan Athabascan (98.3%, a difference of 0.040%), and Slovak (98.4%, a difference of 0.050%).
| Demographics | Rating | Rank | 5th Grade |
| Crow | 100.0 /100 | #1 | Exceptional 99.5% |
| Welsh | 100.0 /100 | #2 | Exceptional 98.6% |
| Norwegians | 100.0 /100 | #3 | Exceptional 98.4% |
| Tsimshian | 100.0 /100 | #4 | Exceptional 98.4% |
| Slovaks | 100.0 /100 | #5 | Exceptional 98.4% |
| Germans | 100.0 /100 | #6 | Exceptional 98.4% |
| Inupiat | 100.0 /100 | #7 | Exceptional 98.4% |
| Slovenes | 100.0 /100 | #8 | Exceptional 98.3% |
| Swedes | 100.0 /100 | #9 | Exceptional 98.3% |
| English | 100.0 /100 | #10 | Exceptional 98.3% |
| Alaskan Athabascans | 100.0 /100 | #11 | Exceptional 98.3% |
| Carpatho Rusyns | 100.0 /100 | #12 | Exceptional 98.3% |
| Tlingit-Haida | 100.0 /100 | #13 | Exceptional 98.3% |
| Dutch | 100.0 /100 | #14 | Exceptional 98.3% |
| Scottish | 100.0 /100 | #15 | Exceptional 98.3% |