Immigrants from Korea vs Immigrants from Germany 5th Grade

COMPARE

Immigrants from Korea
Race
Ancestry
AfghanAfricanAlaska NativeAlaskan AthabascanAlbanianAleutAlsatianAmericanApacheArabArapahoArgentineanArmenianAssyrian/Chaldean/SyriacAustralianAustrianBahamianBangladeshiBarbadianBasqueBelgianBelizeanBermudanBhutaneseBlackfeetBolivianBrazilianBritishBritish West IndianBulgarianBurmeseCajunCambodianCanadianCape VerdeanCarpatho RusynCelticCentral AmericanCentral American IndianCherokeeCheyenneChickasawChileanChineseChippewaChoctawColombianColvilleComancheCosta RicanCreeCreekCroatianCrowCubanCypriotCzechCzechoslovakianDanishDelawareDominicanDutchDutch West IndianEastern EuropeanEcuadorianEgyptianEnglishEstonianEthiopianEuropeanFijianFilipinoFinnishFrenchFrench American IndianFrench CanadianGermanGerman RussianGhanaianGreekGuamanian/ChamorroGuatemalanGuyaneseHaitianHmongHonduranHopiHoumaHungarianIcelanderIndian (Asian)IndonesianInupiatIranianIraqiIrishIroquoisIsraeliItalianJamaicanJapaneseJordanianKenyanKiowaKoreanLaotianLatvianLebaneseLiberianLithuanianLumbeeLuxembourgerMacedonianMalaysianMalteseMarshalleseMenomineeMexicanMexican American IndianMongolianMoroccanNative HawaiianNavajoNepaleseNew ZealanderNicaraguanNigerianNorthern EuropeanNorwegianOkinawanOsageOttawaPaiutePakistaniPalestinianPanamanianParaguayanPennsylvania GermanPeruvianPimaPolishPortuguesePotawatomiPuebloPuerto RicanPuget Sound SalishRomanianRussianSalvadoranSamoanScandinavianScotch-IrishScottishSeminoleSenegaleseSerbianShoshoneSierra LeoneanSiouxSlavicSlovakSloveneSomaliSouth AfricanSouth AmericanSouth American IndianSoviet UnionSpaniardSpanishSpanish AmericanSpanish American IndianSri LankanSubsaharan AfricanSudaneseSwedishSwissSyrianTaiwaneseThaiTlingit-HaidaTohono O'OdhamTonganTrinidadian and TobagonianTsimshianTurkishU.S. Virgin IslanderUgandanUkrainianUruguayanUteVenezuelanVietnameseWelshWest IndianYakamaYaquiYugoslavianYumanYup'ikZimbabwean
Immigration
NonimmigrantsImmigrantsAfghanistanAfricaAlbaniaArgentinaArmeniaAsiaAustraliaAustriaBahamasBangladeshBarbadosBelarusBelgiumBelizeBoliviaBosnia and HerzegovinaBrazilBulgariaBurma/MyanmarCabo VerdeCambodiaCameroonCanadaCaribbeanCentral AmericaChileChinaColombiaCongoCosta RicaCroatiaCubaCzechoslovakiaDenmarkDominicaDominican RepublicEastern AfricaEastern AsiaEastern EuropeEcuadorEgyptEl SalvadorEnglandEritreaEthiopiaEuropeFijiFranceGhanaGreeceGrenadaGuatemalaGuyanaHaitiHondurasHong KongHungaryIndiaIndonesiaIranIraqIrelandIsraelItalyJamaicaJapanJordanKazakhstanKenyaKoreaKuwaitLaosLatin AmericaLatviaLebanonLiberiaLithuaniaMalaysiaMexicoMicronesiaMiddle AfricaMoldovaMoroccoNepalNetherlandsNicaraguaNigeriaNorth AmericaNorth MacedoniaNorthern AfricaNorthern EuropeNorwayOceaniaPakistanPanamaPeruPhilippinesPolandPortugalRomaniaRussiaSaudi ArabiaScotlandSenegalSerbiaSierra LeoneSingaporeSomaliaSouth AfricaSouth AmericaSouth Central AsiaSouth Eastern AsiaSouthern EuropeSpainSri LankaSt. Vincent and the GrenadinesSudanSwedenSwitzerlandSyriaTaiwanThailandTrinidad and TobagoTurkeyUgandaUkraineUruguayUzbekistanVenezuelaVietnamWest IndiesWestern AfricaWestern AsiaWestern EuropeYemenZaireZimbabweAzores
Immigrants from Germany
Race
Ancestry
AfghanAfricanAlaska NativeAlaskan AthabascanAlbanianAleutAlsatianAmericanApacheArabArapahoArgentineanArmenianAssyrian/Chaldean/SyriacAustralianAustrianBahamianBangladeshiBarbadianBasqueBelgianBelizeanBermudanBhutaneseBlackfeetBolivianBrazilianBritishBritish West IndianBulgarianBurmeseCajunCambodianCanadianCape VerdeanCarpatho RusynCelticCentral AmericanCentral American IndianCherokeeCheyenneChickasawChileanChineseChippewaChoctawColombianColvilleComancheCosta RicanCreeCreekCroatianCrowCubanCypriotCzechCzechoslovakianDanishDelawareDominicanDutchDutch West IndianEastern EuropeanEcuadorianEgyptianEnglishEstonianEthiopianEuropeanFijianFilipinoFinnishFrenchFrench American IndianFrench CanadianGermanGerman RussianGhanaianGreekGuamanian/ChamorroGuatemalanGuyaneseHaitianHmongHonduranHopiHoumaHungarianIcelanderIndian (Asian)IndonesianInupiatIranianIraqiIrishIroquoisIsraeliItalianJamaicanJapaneseJordanianKenyanKiowaKoreanLaotianLatvianLebaneseLiberianLithuanianLumbeeLuxembourgerMacedonianMalaysianMalteseMarshalleseMenomineeMexicanMexican American IndianMongolianMoroccanNative HawaiianNavajoNepaleseNew ZealanderNicaraguanNigerianNorthern EuropeanNorwegianOkinawanOsageOttawaPaiutePakistaniPalestinianPanamanianParaguayanPennsylvania GermanPeruvianPimaPolishPortuguesePotawatomiPuebloPuerto RicanPuget Sound SalishRomanianRussianSalvadoranSamoanScandinavianScotch-IrishScottishSeminoleSenegaleseSerbianShoshoneSierra LeoneanSiouxSlavicSlovakSloveneSomaliSouth AfricanSouth AmericanSouth American IndianSoviet UnionSpaniardSpanishSpanish AmericanSpanish American IndianSri LankanSubsaharan AfricanSudaneseSwedishSwissSyrianTaiwaneseThaiTlingit-HaidaTohono O'OdhamTonganTrinidadian and TobagonianTsimshianTurkishU.S. Virgin IslanderUgandanUkrainianUruguayanUteVenezuelanVietnameseWelshWest IndianYakamaYaquiYugoslavianYumanYup'ikZimbabwean
Immigration
NonimmigrantsImmigrantsAfghanistanAfricaAlbaniaArgentinaArmeniaAsiaAustraliaAustriaBahamasBangladeshBarbadosBelarusBelgiumBelizeBoliviaBosnia and HerzegovinaBrazilBulgariaBurma/MyanmarCabo VerdeCambodiaCameroonCanadaCaribbeanCentral AmericaChileChinaColombiaCongoCosta RicaCroatiaCubaCzechoslovakiaDenmarkDominicaDominican RepublicEastern AfricaEastern AsiaEastern EuropeEcuadorEgyptEl SalvadorEnglandEritreaEthiopiaEuropeFijiFranceGermanyGhanaGreeceGrenadaGuatemalaGuyanaHaitiHondurasHong KongHungaryIndiaIndonesiaIranIraqIrelandIsraelItalyJamaicaJapanJordanKazakhstanKenyaKuwaitLaosLatin AmericaLatviaLebanonLiberiaLithuaniaMalaysiaMexicoMicronesiaMiddle AfricaMoldovaMoroccoNepalNetherlandsNicaraguaNigeriaNorth AmericaNorth MacedoniaNorthern AfricaNorthern EuropeNorwayOceaniaPakistanPanamaPeruPhilippinesPolandPortugalRomaniaRussiaSaudi ArabiaScotlandSenegalSerbiaSierra LeoneSingaporeSomaliaSouth AfricaSouth AmericaSouth Central AsiaSouth Eastern AsiaSouthern EuropeSpainSri LankaSt. Vincent and the GrenadinesSudanSwedenSwitzerlandSyriaTaiwanThailandTrinidad and TobagoTurkeyUgandaUkraineUruguayUzbekistanVenezuelaVietnamWest IndiesWestern AfricaWestern AsiaWestern EuropeYemenZaireZimbabweAzores
5th Grade
Income
Poverty
Unemployment
Labor Participation
Family Structure
Vehicle Availability
Education Level
Disability

5th Grade Comparison

Immigrants from Korea

Immigrants from Germany

Average
Exceptional
97.3%
5TH GRADE
54.1/ 100
METRIC RATING
169th/ 347
METRIC RANK
97.8%
5TH GRADE
98.5/ 100
METRIC RATING
96th/ 347
METRIC RANK

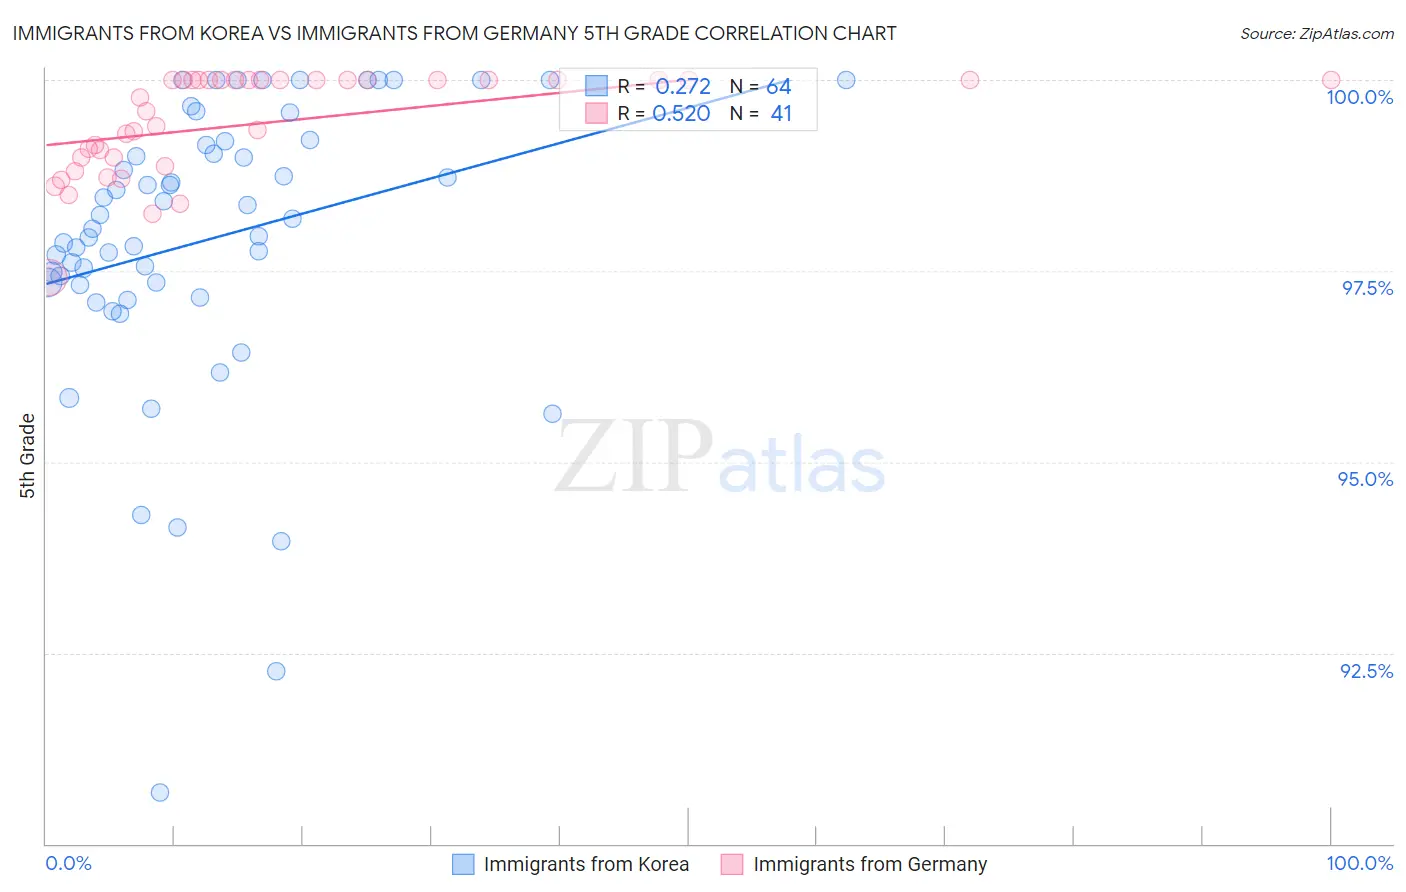
Immigrants from Korea vs Immigrants from Germany 5th Grade Correlation Chart

The statistical analysis conducted on geographies consisting of 416,280,076 people shows a weak positive correlation between the proportion of Immigrants from Korea and percentage of population with at least 5th grade education in the United States with a correlation coefficient (R) of 0.272 and weighted average of 97.3%. Similarly, the statistical analysis conducted on geographies consisting of 463,886,643 people shows a substantial positive correlation between the proportion of Immigrants from Germany and percentage of population with at least 5th grade education in the United States with a correlation coefficient (R) of 0.520 and weighted average of 97.8%, a difference of 0.42%.
Immigrants from Korea vs Immigrants from Germany 5th Grade

5th Grade Correlation Summary

MeasurementImmigrants from KoreaImmigrants from Germany
Minimum90.7%97.4%
Maximum100.0%100.0%
Range9.3%2.6%
Mean97.9%99.4%
Median98.1%99.8%
Interquartile 25% (IQ1)97.3%98.9%
Interquartile 75% (IQ3)99.2%100.0%
Interquartile Range (IQR)1.8%1.1%
Standard Deviation (Sample)1.9%0.67%
Standard Deviation (Population)1.9%0.66%

Similar Demographics by 5th Grade

Demographics Similar to Immigrants from Korea by 5th Grade

In terms of 5th grade, the demographic groups most similar to Immigrants from Korea are Immigrants from Belarus (97.3%, a difference of 0.0%), Chilean (97.3%, a difference of 0.0%), Venezuelan (97.3%, a difference of 0.0%), Immigrants from Sri Lanka (97.3%, a difference of 0.0%), and Arab (97.3%, a difference of 0.0%).
DemographicsRating | Rank5th Grade
Immigrants | Iran
59.5
/100
|
#162
Average
97.4%
Ugandans
58.9
/100
|
#163
Average
97.4%
Bermudans
58.8
/100
|
#164
Average
97.4%
Immigrants | Poland
57.9
/100
|
#165
Average
97.4%
Apache
57.2
/100
|
#166
Average
97.4%
Immigrants | Belarus
54.6
/100
|
#167
Average
97.3%
Chileans
54.5
/100
|
#168
Average
97.3%
Immigrants | Korea
54.1
/100
|
#169
Average
97.3%
Venezuelans
54.0
/100
|
#170
Average
97.3%
Immigrants | Sri Lanka
53.8
/100
|
#171
Average
97.3%
Arabs
53.4
/100
|
#172
Average
97.3%
Egyptians
52.4
/100
|
#173
Average
97.3%
Immigrants | Kazakhstan
50.0
/100
|
#174
Average
97.3%
Immigrants | Micronesia
48.8
/100
|
#175
Average
97.3%
Immigrants | Taiwan
48.4
/100
|
#176
Average
97.3%

Demographics Similar to Immigrants from Germany by 5th Grade

In terms of 5th grade, the demographic groups most similar to Immigrants from Germany are Immigrants from Denmark (97.8%, a difference of 0.0%), Romanian (97.8%, a difference of 0.0%), Immigrants from Sweden (97.8%, a difference of 0.010%), Delaware (97.8%, a difference of 0.010%), and Cree (97.7%, a difference of 0.010%).
DemographicsRating | Rank5th Grade
Immigrants | South Africa
98.8
/100
|
#89
Exceptional
97.8%
Immigrants | Ireland
98.8
/100
|
#90
Exceptional
97.8%
Immigrants | Western Europe
98.8
/100
|
#91
Exceptional
97.8%
Immigrants | Sweden
98.7
/100
|
#92
Exceptional
97.8%
Delaware
98.6
/100
|
#93
Exceptional
97.8%
Immigrants | Denmark
98.6
/100
|
#94
Exceptional
97.8%
Romanians
98.6
/100
|
#95
Exceptional
97.8%
Immigrants | Germany
98.5
/100
|
#96
Exceptional
97.8%
Cree
98.4
/100
|
#97
Exceptional
97.7%
Yugoslavians
98.3
/100
|
#98
Exceptional
97.7%
Turks
98.3
/100
|
#99
Exceptional
97.7%
Puget Sound Salish
98.3
/100
|
#100
Exceptional
97.7%
South Africans
98.3
/100
|
#101
Exceptional
97.7%
Choctaw
98.0
/100
|
#102
Exceptional
97.7%
Cheyenne
97.9
/100
|
#103
Exceptional
97.7%