Immigrants from Kazakhstan vs Immigrants from Italy 4th Grade
COMPARE
Immigrants from Kazakhstan
Immigrants from Italy
4th Grade
4th Grade Comparison
Immigrants from Kazakhstan
Immigrants from Italy
97.5%
4TH GRADE
43.6/ 100
METRIC RATING
179th/ 347
METRIC RANK
97.6%
4TH GRADE
63.7/ 100
METRIC RATING
159th/ 347
METRIC RANK
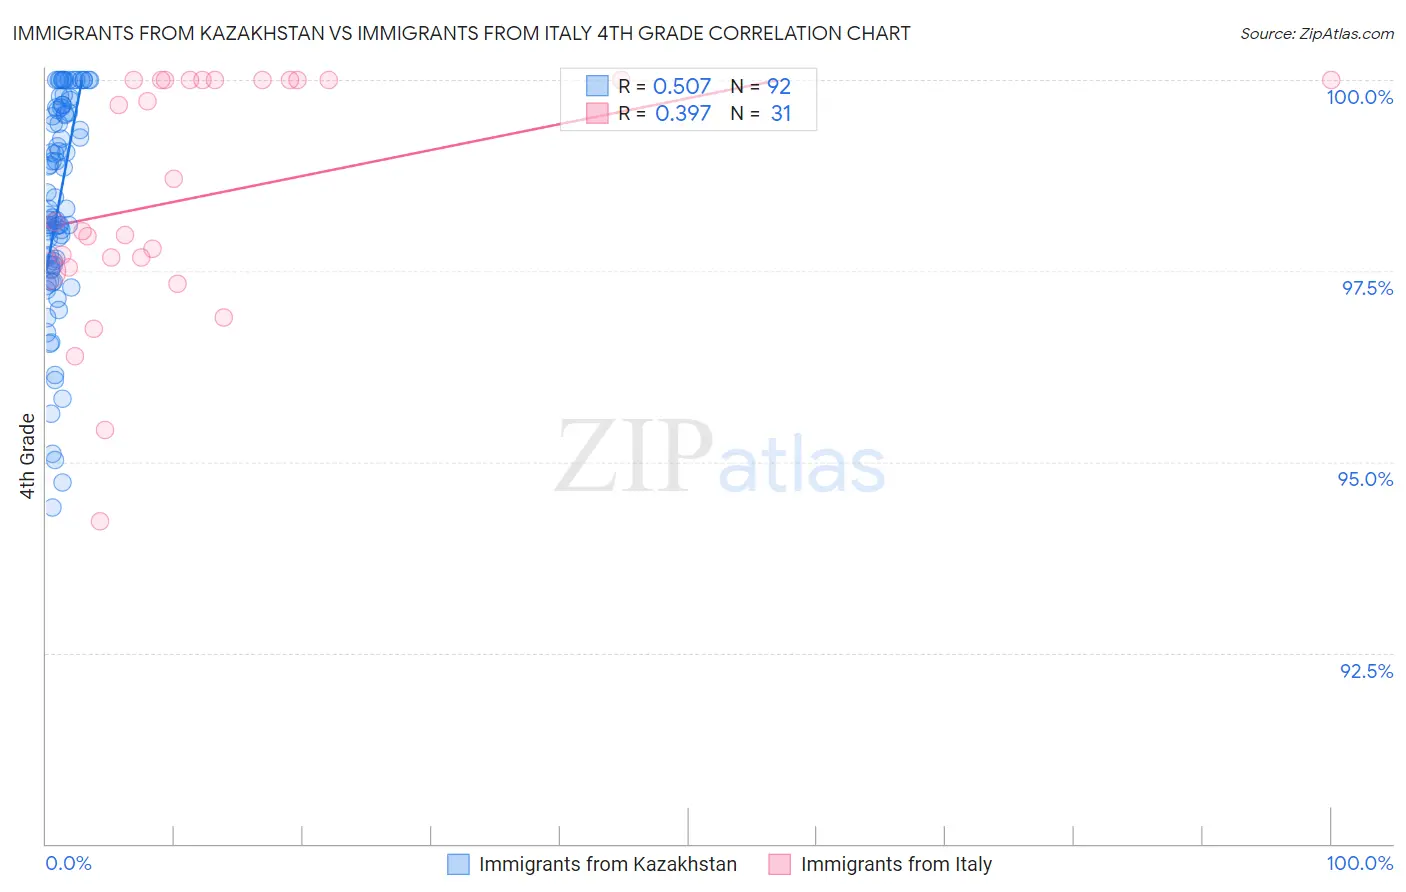
Immigrants from Kazakhstan vs Immigrants from Italy 4th Grade Correlation Chart
The statistical analysis conducted on geographies consisting of 124,430,097 people shows a substantial positive correlation between the proportion of Immigrants from Kazakhstan and percentage of population with at least 4th grade education in the United States with a correlation coefficient (R) of 0.507 and weighted average of 97.5%. Similarly, the statistical analysis conducted on geographies consisting of 324,225,917 people shows a mild positive correlation between the proportion of Immigrants from Italy and percentage of population with at least 4th grade education in the United States with a correlation coefficient (R) of 0.397 and weighted average of 97.6%, a difference of 0.080%.
4th Grade Correlation Summary
| Measurement | Immigrants from Kazakhstan | Immigrants from Italy |
| Minimum | 94.4% | 94.2% |
| Maximum | 100.0% | 100.0% |
| Range | 5.6% | 5.8% |
| Mean | 98.4% | 98.5% |
| Median | 98.3% | 98.1% |
| Interquartile 25% (IQ1) | 97.6% | 97.5% |
| Interquartile 75% (IQ3) | 99.6% | 100.0% |
| Interquartile Range (IQR) | 2.0% | 2.5% |
| Standard Deviation (Sample) | 1.4% | 1.6% |
| Standard Deviation (Population) | 1.4% | 1.6% |
Demographics Similar to Immigrants from Kazakhstan and Immigrants from Italy by 4th Grade
In terms of 4th grade, the demographic groups most similar to Immigrants from Kazakhstan are Immigrants from Brazil (97.5%, a difference of 0.010%), Comanche (97.5%, a difference of 0.010%), Egyptian (97.5%, a difference of 0.020%), Immigrants from Micronesia (97.5%, a difference of 0.020%), and Arab (97.5%, a difference of 0.020%). Similarly, the demographic groups most similar to Immigrants from Italy are Apache (97.6%, a difference of 0.010%), Marshallese (97.6%, a difference of 0.010%), Bermudan (97.6%, a difference of 0.010%), Immigrants from Iran (97.6%, a difference of 0.010%), and Ugandan (97.6%, a difference of 0.020%).
| Demographics | Rating | Rank | 4th Grade |
| Immigrants | Italy | 63.7 /100 | #159 | Good 97.6% |
| Apache | 61.3 /100 | #160 | Good 97.6% |
| Marshallese | 60.8 /100 | #161 | Good 97.6% |
| Bermudans | 60.5 /100 | #162 | Good 97.6% |
| Immigrants | Iran | 60.3 /100 | #163 | Good 97.6% |
| Ugandans | 58.9 /100 | #164 | Average 97.6% |
| Venezuelans | 58.7 /100 | #165 | Average 97.6% |
| Kenyans | 56.5 /100 | #166 | Average 97.5% |
| Immigrants | Poland | 55.9 /100 | #167 | Average 97.5% |
| Immigrants | Belarus | 55.8 /100 | #168 | Average 97.5% |
| Chileans | 54.4 /100 | #169 | Average 97.5% |
| Immigrants | Spain | 51.8 /100 | #170 | Average 97.5% |
| Brazilians | 51.5 /100 | #171 | Average 97.5% |
| Immigrants | Sri Lanka | 51.1 /100 | #172 | Average 97.5% |
| Immigrants | Korea | 50.6 /100 | #173 | Average 97.5% |
| Egyptians | 50.0 /100 | #174 | Average 97.5% |
| Immigrants | Micronesia | 49.6 /100 | #175 | Average 97.5% |
| Arabs | 48.7 /100 | #176 | Average 97.5% |
| Immigrants | Brazil | 46.1 /100 | #177 | Average 97.5% |
| Comanche | 45.3 /100 | #178 | Average 97.5% |
| Immigrants | Kazakhstan | 43.6 /100 | #179 | Average 97.5% |