Welsh vs Immigrants from Italy 4th Grade
COMPARE
Welsh
Immigrants from Italy
4th Grade
4th Grade Comparison
Welsh
Immigrants from Italy
98.7%
4TH GRADE
100.0/ 100
METRIC RATING
2nd/ 347
METRIC RANK
97.6%
4TH GRADE
63.7/ 100
METRIC RATING
159th/ 347
METRIC RANK
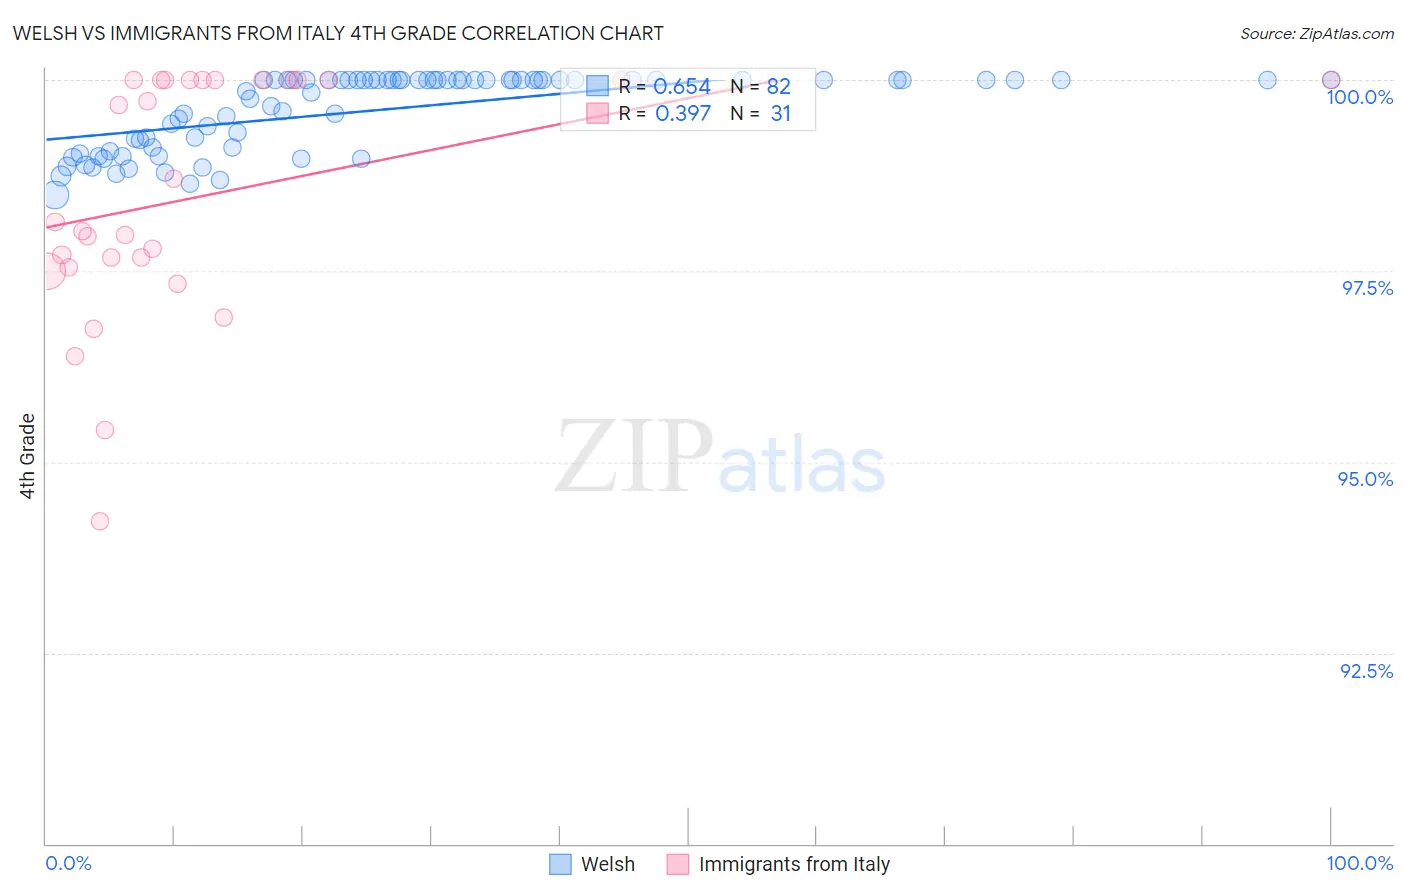
Welsh vs Immigrants from Italy 4th Grade Correlation Chart
The statistical analysis conducted on geographies consisting of 239,959,962 people shows a significant positive correlation between the proportion of Welsh and percentage of population with at least 4th grade education in the United States with a correlation coefficient (R) of 0.654 and weighted average of 98.7%. Similarly, the statistical analysis conducted on geographies consisting of 324,225,917 people shows a mild positive correlation between the proportion of Immigrants from Italy and percentage of population with at least 4th grade education in the United States with a correlation coefficient (R) of 0.397 and weighted average of 97.6%, a difference of 1.1%.
4th Grade Correlation Summary
| Measurement | Welsh | Immigrants from Italy |
| Minimum | 98.5% | 94.2% |
| Maximum | 100.0% | 100.0% |
| Range | 1.5% | 5.8% |
| Mean | 99.6% | 98.5% |
| Median | 100.0% | 98.1% |
| Interquartile 25% (IQ1) | 99.1% | 97.5% |
| Interquartile 75% (IQ3) | 100.0% | 100.0% |
| Interquartile Range (IQR) | 0.89% | 2.5% |
| Standard Deviation (Sample) | 0.49% | 1.6% |
| Standard Deviation (Population) | 0.49% | 1.6% |
Similar Demographics by 4th Grade
Demographics Similar to Welsh by 4th Grade
In terms of 4th grade, the demographic groups most similar to Welsh are Tsimshian (98.6%, a difference of 0.060%), Inupiat (98.6%, a difference of 0.12%), Yup'ik (98.5%, a difference of 0.15%), Norwegian (98.5%, a difference of 0.19%), and Slovak (98.5%, a difference of 0.20%).
| Demographics | Rating | Rank | 4th Grade |
| Crow | 100.0 /100 | #1 | Exceptional 99.6% |
| Welsh | 100.0 /100 | #2 | Exceptional 98.7% |
| Tsimshian | 100.0 /100 | #3 | Exceptional 98.6% |
| Inupiat | 100.0 /100 | #4 | Exceptional 98.6% |
| Yup'ik | 100.0 /100 | #5 | Exceptional 98.5% |
| Norwegians | 100.0 /100 | #6 | Exceptional 98.5% |
| Slovaks | 100.0 /100 | #7 | Exceptional 98.5% |
| Germans | 100.0 /100 | #8 | Exceptional 98.5% |
| Slovenes | 100.0 /100 | #9 | Exceptional 98.4% |
| Alaskan Athabascans | 100.0 /100 | #10 | Exceptional 98.4% |
| English | 100.0 /100 | #11 | Exceptional 98.4% |
| Tlingit-Haida | 100.0 /100 | #12 | Exceptional 98.4% |
| Swedes | 100.0 /100 | #13 | Exceptional 98.4% |
| Carpatho Rusyns | 100.0 /100 | #14 | Exceptional 98.4% |
| Dutch | 100.0 /100 | #15 | Exceptional 98.4% |
Demographics Similar to Immigrants from Italy by 4th Grade
In terms of 4th grade, the demographic groups most similar to Immigrants from Italy are Immigrants from Russia (97.6%, a difference of 0.010%), Albanian (97.6%, a difference of 0.010%), Immigrants from Jordan (97.6%, a difference of 0.010%), Immigrants from Bosnia and Herzegovina (97.6%, a difference of 0.010%), and French American Indian (97.6%, a difference of 0.010%).
| Demographics | Rating | Rank | 4th Grade |
| Immigrants | South Central Asia | 76.2 /100 | #152 | Good 97.6% |
| Immigrants | Eastern Europe | 71.3 /100 | #153 | Good 97.6% |
| Immigrants | Russia | 67.0 /100 | #154 | Good 97.6% |
| Albanians | 67.0 /100 | #155 | Good 97.6% |
| Immigrants | Jordan | 66.9 /100 | #156 | Good 97.6% |
| Immigrants | Bosnia and Herzegovina | 66.0 /100 | #157 | Good 97.6% |
| French American Indians | 65.9 /100 | #158 | Good 97.6% |
| Immigrants | Italy | 63.7 /100 | #159 | Good 97.6% |
| Apache | 61.3 /100 | #160 | Good 97.6% |
| Marshallese | 60.8 /100 | #161 | Good 97.6% |
| Bermudans | 60.5 /100 | #162 | Good 97.6% |
| Immigrants | Iran | 60.3 /100 | #163 | Good 97.6% |
| Ugandans | 58.9 /100 | #164 | Average 97.6% |
| Venezuelans | 58.7 /100 | #165 | Average 97.6% |
| Kenyans | 56.5 /100 | #166 | Average 97.5% |