British West Indian vs Immigrants from Italy 4th Grade
COMPARE
British West Indian
Immigrants from Italy
4th Grade
4th Grade Comparison
British West Indians
Immigrants from Italy
96.7%
4TH GRADE
0.0/ 100
METRIC RATING
290th/ 347
METRIC RANK
97.6%
4TH GRADE
63.7/ 100
METRIC RATING
159th/ 347
METRIC RANK
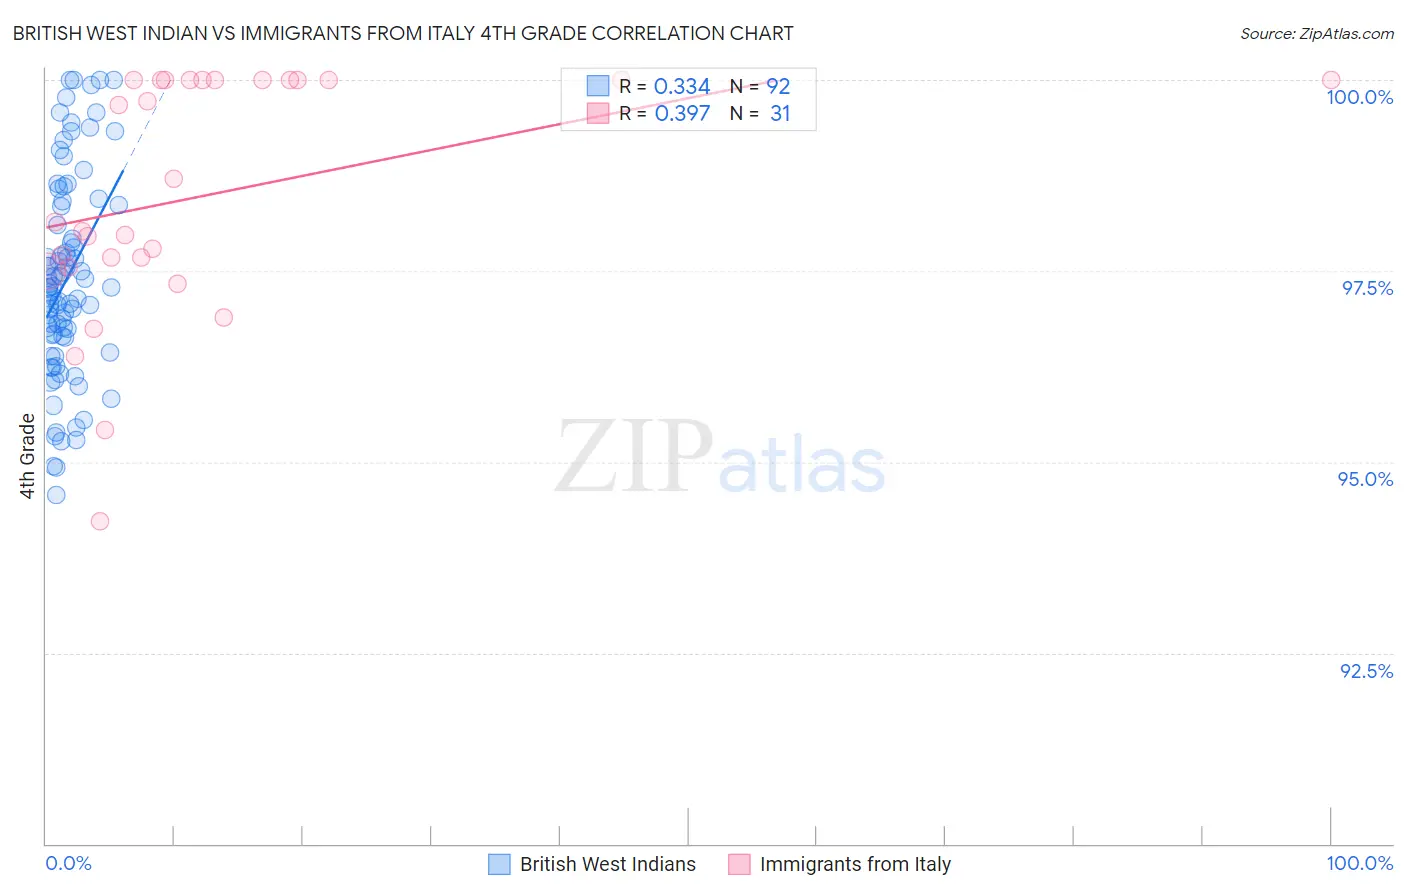
British West Indian vs Immigrants from Italy 4th Grade Correlation Chart
The statistical analysis conducted on geographies consisting of 152,691,173 people shows a mild positive correlation between the proportion of British West Indians and percentage of population with at least 4th grade education in the United States with a correlation coefficient (R) of 0.334 and weighted average of 96.7%. Similarly, the statistical analysis conducted on geographies consisting of 324,225,917 people shows a mild positive correlation between the proportion of Immigrants from Italy and percentage of population with at least 4th grade education in the United States with a correlation coefficient (R) of 0.397 and weighted average of 97.6%, a difference of 0.86%.
4th Grade Correlation Summary
| Measurement | British West Indian | Immigrants from Italy |
| Minimum | 94.6% | 94.2% |
| Maximum | 100.0% | 100.0% |
| Range | 5.4% | 5.8% |
| Mean | 97.4% | 98.5% |
| Median | 97.3% | 98.1% |
| Interquartile 25% (IQ1) | 96.6% | 97.5% |
| Interquartile 75% (IQ3) | 98.4% | 100.0% |
| Interquartile Range (IQR) | 1.7% | 2.5% |
| Standard Deviation (Sample) | 1.3% | 1.6% |
| Standard Deviation (Population) | 1.3% | 1.6% |
Similar Demographics by 4th Grade
Demographics Similar to British West Indians by 4th Grade
In terms of 4th grade, the demographic groups most similar to British West Indians are Immigrants from West Indies (96.7%, a difference of 0.010%), Houma (96.8%, a difference of 0.030%), Immigrants from Afghanistan (96.8%, a difference of 0.030%), Immigrants from Grenada (96.7%, a difference of 0.030%), and Malaysian (96.7%, a difference of 0.040%).
| Demographics | Rating | Rank | 4th Grade |
| Immigrants | Philippines | 0.1 /100 | #283 | Tragic 96.8% |
| Immigrants | St. Vincent and the Grenadines | 0.1 /100 | #284 | Tragic 96.8% |
| Immigrants | Barbados | 0.0 /100 | #285 | Tragic 96.8% |
| Immigrants | Thailand | 0.0 /100 | #286 | Tragic 96.8% |
| Houma | 0.0 /100 | #287 | Tragic 96.8% |
| Immigrants | Afghanistan | 0.0 /100 | #288 | Tragic 96.8% |
| Immigrants | West Indies | 0.0 /100 | #289 | Tragic 96.7% |
| British West Indians | 0.0 /100 | #290 | Tragic 96.7% |
| Immigrants | Grenada | 0.0 /100 | #291 | Tragic 96.7% |
| Malaysians | 0.0 /100 | #292 | Tragic 96.7% |
| Puerto Ricans | 0.0 /100 | #293 | Tragic 96.7% |
| Immigrants | Eritrea | 0.0 /100 | #294 | Tragic 96.7% |
| Immigrants | Portugal | 0.0 /100 | #295 | Tragic 96.6% |
| Somalis | 0.0 /100 | #296 | Tragic 96.6% |
| Immigrants | Somalia | 0.0 /100 | #297 | Tragic 96.5% |
Demographics Similar to Immigrants from Italy by 4th Grade
In terms of 4th grade, the demographic groups most similar to Immigrants from Italy are Immigrants from Russia (97.6%, a difference of 0.010%), Albanian (97.6%, a difference of 0.010%), Immigrants from Jordan (97.6%, a difference of 0.010%), Immigrants from Bosnia and Herzegovina (97.6%, a difference of 0.010%), and French American Indian (97.6%, a difference of 0.010%).
| Demographics | Rating | Rank | 4th Grade |
| Immigrants | South Central Asia | 76.2 /100 | #152 | Good 97.6% |
| Immigrants | Eastern Europe | 71.3 /100 | #153 | Good 97.6% |
| Immigrants | Russia | 67.0 /100 | #154 | Good 97.6% |
| Albanians | 67.0 /100 | #155 | Good 97.6% |
| Immigrants | Jordan | 66.9 /100 | #156 | Good 97.6% |
| Immigrants | Bosnia and Herzegovina | 66.0 /100 | #157 | Good 97.6% |
| French American Indians | 65.9 /100 | #158 | Good 97.6% |
| Immigrants | Italy | 63.7 /100 | #159 | Good 97.6% |
| Apache | 61.3 /100 | #160 | Good 97.6% |
| Marshallese | 60.8 /100 | #161 | Good 97.6% |
| Bermudans | 60.5 /100 | #162 | Good 97.6% |
| Immigrants | Iran | 60.3 /100 | #163 | Good 97.6% |
| Ugandans | 58.9 /100 | #164 | Average 97.6% |
| Venezuelans | 58.7 /100 | #165 | Average 97.6% |
| Kenyans | 56.5 /100 | #166 | Average 97.5% |