Immigrants from Kazakhstan vs Greek 9th Grade
COMPARE
Immigrants from Kazakhstan
Greek
9th Grade
9th Grade Comparison
Immigrants from Kazakhstan
Greeks
95.1%
9TH GRADE
74.7/ 100
METRIC RATING
155th/ 347
METRIC RANK
96.0%
9TH GRADE
99.9/ 100
METRIC RATING
49th/ 347
METRIC RANK
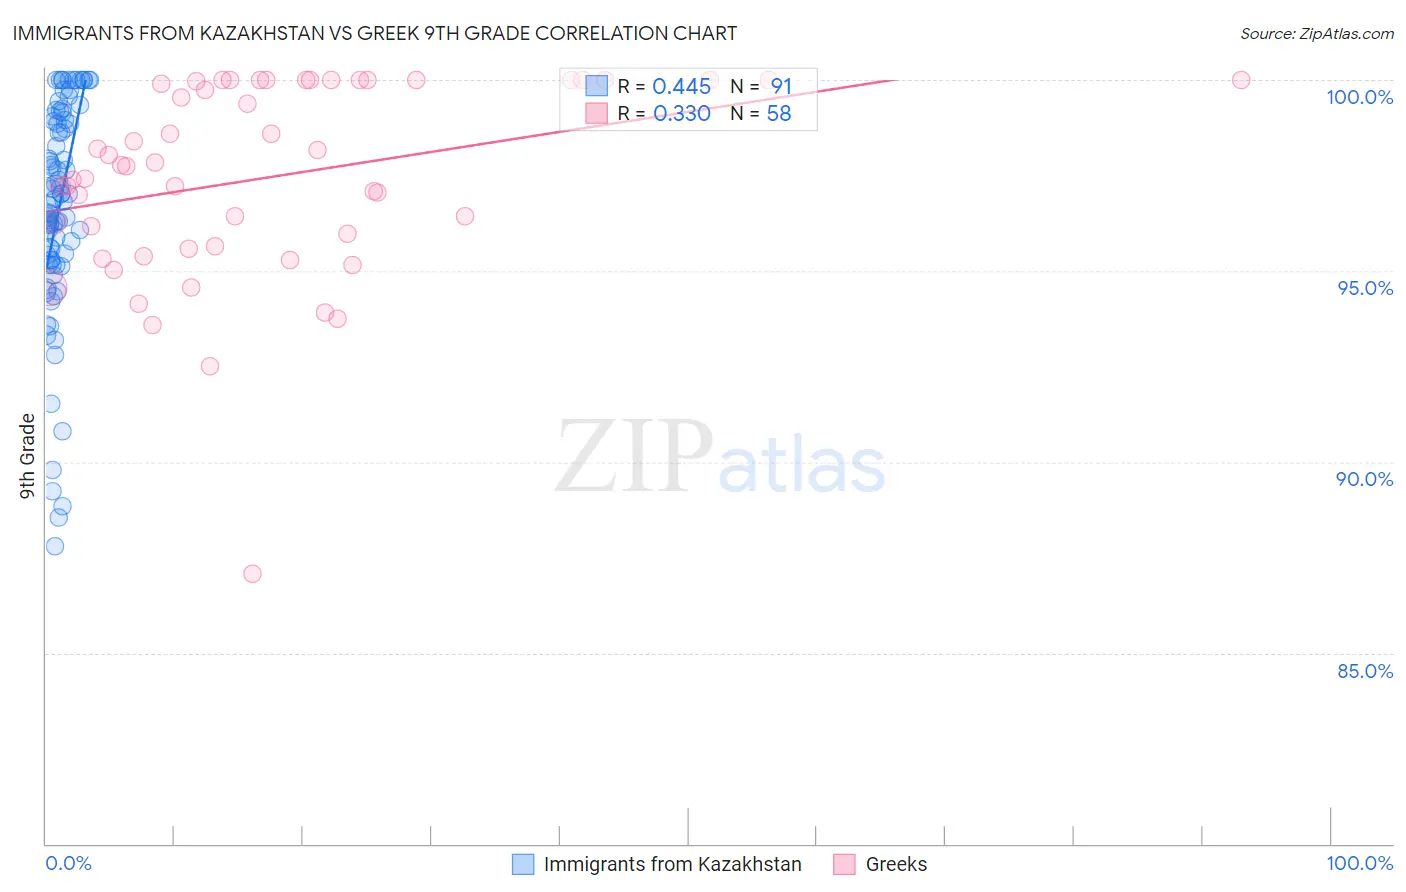
Immigrants from Kazakhstan vs Greek 9th Grade Correlation Chart
The statistical analysis conducted on geographies consisting of 124,429,881 people shows a moderate positive correlation between the proportion of Immigrants from Kazakhstan and percentage of population with at least 9th grade education in the United States with a correlation coefficient (R) of 0.445 and weighted average of 95.1%. Similarly, the statistical analysis conducted on geographies consisting of 482,775,358 people shows a mild positive correlation between the proportion of Greeks and percentage of population with at least 9th grade education in the United States with a correlation coefficient (R) of 0.330 and weighted average of 96.0%, a difference of 1.0%.
9th Grade Correlation Summary
| Measurement | Immigrants from Kazakhstan | Greek |
| Minimum | 87.8% | 87.1% |
| Maximum | 100.0% | 100.0% |
| Range | 12.2% | 12.9% |
| Mean | 96.6% | 97.5% |
| Median | 96.9% | 97.7% |
| Interquartile 25% (IQ1) | 95.3% | 95.6% |
| Interquartile 75% (IQ3) | 98.9% | 100.0% |
| Interquartile Range (IQR) | 3.7% | 4.4% |
| Standard Deviation (Sample) | 2.8% | 2.6% |
| Standard Deviation (Population) | 2.8% | 2.5% |
Similar Demographics by 9th Grade
Demographics Similar to Immigrants from Kazakhstan by 9th Grade
In terms of 9th grade, the demographic groups most similar to Immigrants from Kazakhstan are Arab (95.1%, a difference of 0.0%), Albanian (95.1%, a difference of 0.010%), Ugandan (95.1%, a difference of 0.020%), Immigrants from Kenya (95.0%, a difference of 0.020%), and Mongolian (95.0%, a difference of 0.020%).
| Demographics | Rating | Rank | 9th Grade |
| Immigrants | Jordan | 81.2 /100 | #148 | Excellent 95.1% |
| Immigrants | Korea | 79.6 /100 | #149 | Good 95.1% |
| Kenyans | 79.1 /100 | #150 | Good 95.1% |
| Cajuns | 77.3 /100 | #151 | Good 95.1% |
| Ugandans | 77.0 /100 | #152 | Good 95.1% |
| Albanians | 76.1 /100 | #153 | Good 95.1% |
| Arabs | 74.9 /100 | #154 | Good 95.1% |
| Immigrants | Kazakhstan | 74.7 /100 | #155 | Good 95.1% |
| Immigrants | Kenya | 73.1 /100 | #156 | Good 95.0% |
| Mongolians | 73.0 /100 | #157 | Good 95.0% |
| Egyptians | 70.1 /100 | #158 | Good 95.0% |
| Immigrants | Ukraine | 67.4 /100 | #159 | Good 95.0% |
| Immigrants | Italy | 66.6 /100 | #160 | Good 95.0% |
| French American Indians | 66.5 /100 | #161 | Good 95.0% |
| Bermudans | 65.8 /100 | #162 | Good 95.0% |
Demographics Similar to Greeks by 9th Grade
In terms of 9th grade, the demographic groups most similar to Greeks are Russian (96.0%, a difference of 0.010%), Australian (96.0%, a difference of 0.010%), Celtic (96.0%, a difference of 0.010%), Crow (96.1%, a difference of 0.020%), and Immigrants from India (96.1%, a difference of 0.020%).
| Demographics | Rating | Rank | 9th Grade |
| Chippewa | 99.9 /100 | #42 | Exceptional 96.1% |
| Iranians | 99.9 /100 | #43 | Exceptional 96.1% |
| Alaska Natives | 99.9 /100 | #44 | Exceptional 96.1% |
| Crow | 99.9 /100 | #45 | Exceptional 96.1% |
| Immigrants | India | 99.9 /100 | #46 | Exceptional 96.1% |
| Russians | 99.9 /100 | #47 | Exceptional 96.0% |
| Australians | 99.9 /100 | #48 | Exceptional 96.0% |
| Greeks | 99.9 /100 | #49 | Exceptional 96.0% |
| Celtics | 99.9 /100 | #50 | Exceptional 96.0% |
| Immigrants | Northern Europe | 99.9 /100 | #51 | Exceptional 96.0% |
| Serbians | 99.9 /100 | #52 | Exceptional 96.0% |
| Austrians | 99.8 /100 | #53 | Exceptional 96.0% |
| Immigrants | Canada | 99.8 /100 | #54 | Exceptional 96.0% |
| Immigrants | Austria | 99.8 /100 | #55 | Exceptional 96.0% |
| Immigrants | North America | 99.8 /100 | #56 | Exceptional 96.0% |