Immigrants from Kazakhstan vs Chinese 7th Grade
COMPARE
Immigrants from Kazakhstan
Chinese
7th Grade
7th Grade Comparison
Immigrants from Kazakhstan
Chinese
96.1%
7TH GRADE
61.0/ 100
METRIC RATING
166th/ 347
METRIC RANK
97.1%
7TH GRADE
99.9/ 100
METRIC RATING
42nd/ 347
METRIC RANK
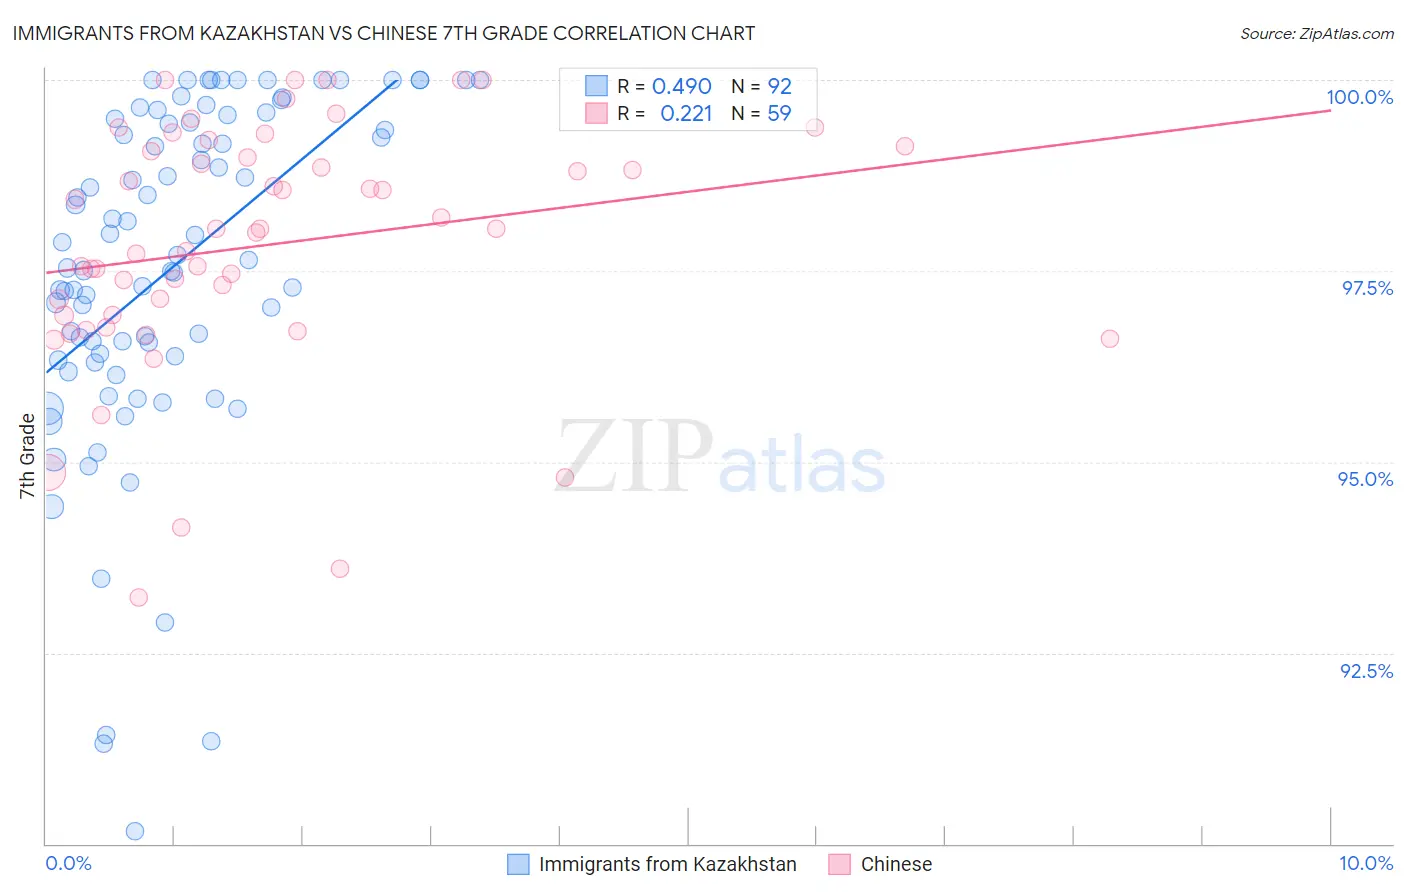
Immigrants from Kazakhstan vs Chinese 7th Grade Correlation Chart
The statistical analysis conducted on geographies consisting of 124,430,097 people shows a moderate positive correlation between the proportion of Immigrants from Kazakhstan and percentage of population with at least 7th grade education in the United States with a correlation coefficient (R) of 0.490 and weighted average of 96.1%. Similarly, the statistical analysis conducted on geographies consisting of 64,809,883 people shows a weak positive correlation between the proportion of Chinese and percentage of population with at least 7th grade education in the United States with a correlation coefficient (R) of 0.221 and weighted average of 97.1%, a difference of 1.1%.
7th Grade Correlation Summary
| Measurement | Immigrants from Kazakhstan | Chinese |
| Minimum | 90.2% | 93.2% |
| Maximum | 100.0% | 100.0% |
| Range | 9.8% | 6.8% |
| Mean | 97.5% | 97.8% |
| Median | 97.7% | 98.0% |
| Interquartile 25% (IQ1) | 96.4% | 96.9% |
| Interquartile 75% (IQ3) | 99.5% | 99.1% |
| Interquartile Range (IQR) | 3.1% | 2.2% |
| Standard Deviation (Sample) | 2.2% | 1.6% |
| Standard Deviation (Population) | 2.2% | 1.6% |
Similar Demographics by 7th Grade
Demographics Similar to Immigrants from Kazakhstan by 7th Grade
In terms of 7th grade, the demographic groups most similar to Immigrants from Kazakhstan are Immigrants from Taiwan (96.1%, a difference of 0.0%), Spaniard (96.1%, a difference of 0.010%), Immigrants from Italy (96.1%, a difference of 0.010%), Immigrants from Sri Lanka (96.1%, a difference of 0.010%), and Immigrants from Poland (96.1%, a difference of 0.010%).
| Demographics | Rating | Rank | 7th Grade |
| Alsatians | 67.2 /100 | #159 | Good 96.1% |
| Immigrants | Kenya | 66.8 /100 | #160 | Good 96.1% |
| Bermudans | 66.3 /100 | #161 | Good 96.1% |
| Pima | 64.3 /100 | #162 | Good 96.1% |
| Spaniards | 62.6 /100 | #163 | Good 96.1% |
| Immigrants | Italy | 62.1 /100 | #164 | Good 96.1% |
| Immigrants | Taiwan | 61.5 /100 | #165 | Good 96.1% |
| Immigrants | Kazakhstan | 61.0 /100 | #166 | Good 96.1% |
| Immigrants | Sri Lanka | 59.9 /100 | #167 | Average 96.1% |
| Immigrants | Poland | 59.0 /100 | #168 | Average 96.1% |
| Ute | 55.8 /100 | #169 | Average 96.1% |
| Immigrants | Ukraine | 55.0 /100 | #170 | Average 96.1% |
| Egyptians | 54.2 /100 | #171 | Average 96.1% |
| Venezuelans | 51.4 /100 | #172 | Average 96.0% |
| Immigrants | Albania | 50.4 /100 | #173 | Average 96.0% |
Demographics Similar to Chinese by 7th Grade
In terms of 7th grade, the demographic groups most similar to Chinese are Maltese (97.1%, a difference of 0.030%), Eastern European (97.2%, a difference of 0.040%), Northern European (97.1%, a difference of 0.040%), Czechoslovakian (97.1%, a difference of 0.040%), and Aleut (97.1%, a difference of 0.050%).
| Demographics | Rating | Rank | 7th Grade |
| Swiss | 100.0 /100 | #35 | Exceptional 97.3% |
| Hungarians | 100.0 /100 | #36 | Exceptional 97.2% |
| British | 100.0 /100 | #37 | Exceptional 97.2% |
| Belgians | 100.0 /100 | #38 | Exceptional 97.2% |
| Latvians | 100.0 /100 | #39 | Exceptional 97.2% |
| Luxembourgers | 100.0 /100 | #40 | Exceptional 97.2% |
| Eastern Europeans | 100.0 /100 | #41 | Exceptional 97.2% |
| Chinese | 99.9 /100 | #42 | Exceptional 97.1% |
| Maltese | 99.9 /100 | #43 | Exceptional 97.1% |
| Northern Europeans | 99.9 /100 | #44 | Exceptional 97.1% |
| Czechoslovakians | 99.9 /100 | #45 | Exceptional 97.1% |
| Aleuts | 99.9 /100 | #46 | Exceptional 97.1% |
| Bulgarians | 99.9 /100 | #47 | Exceptional 97.1% |
| Celtics | 99.9 /100 | #48 | Exceptional 97.1% |
| Slavs | 99.9 /100 | #49 | Exceptional 97.1% |