Immigrants from Kazakhstan vs Hmong 7th Grade
COMPARE
Immigrants from Kazakhstan
Hmong
7th Grade
7th Grade Comparison
Immigrants from Kazakhstan
Hmong
96.1%
7TH GRADE
61.0/ 100
METRIC RATING
166th/ 347
METRIC RANK
96.4%
7TH GRADE
91.5/ 100
METRIC RATING
133rd/ 347
METRIC RANK
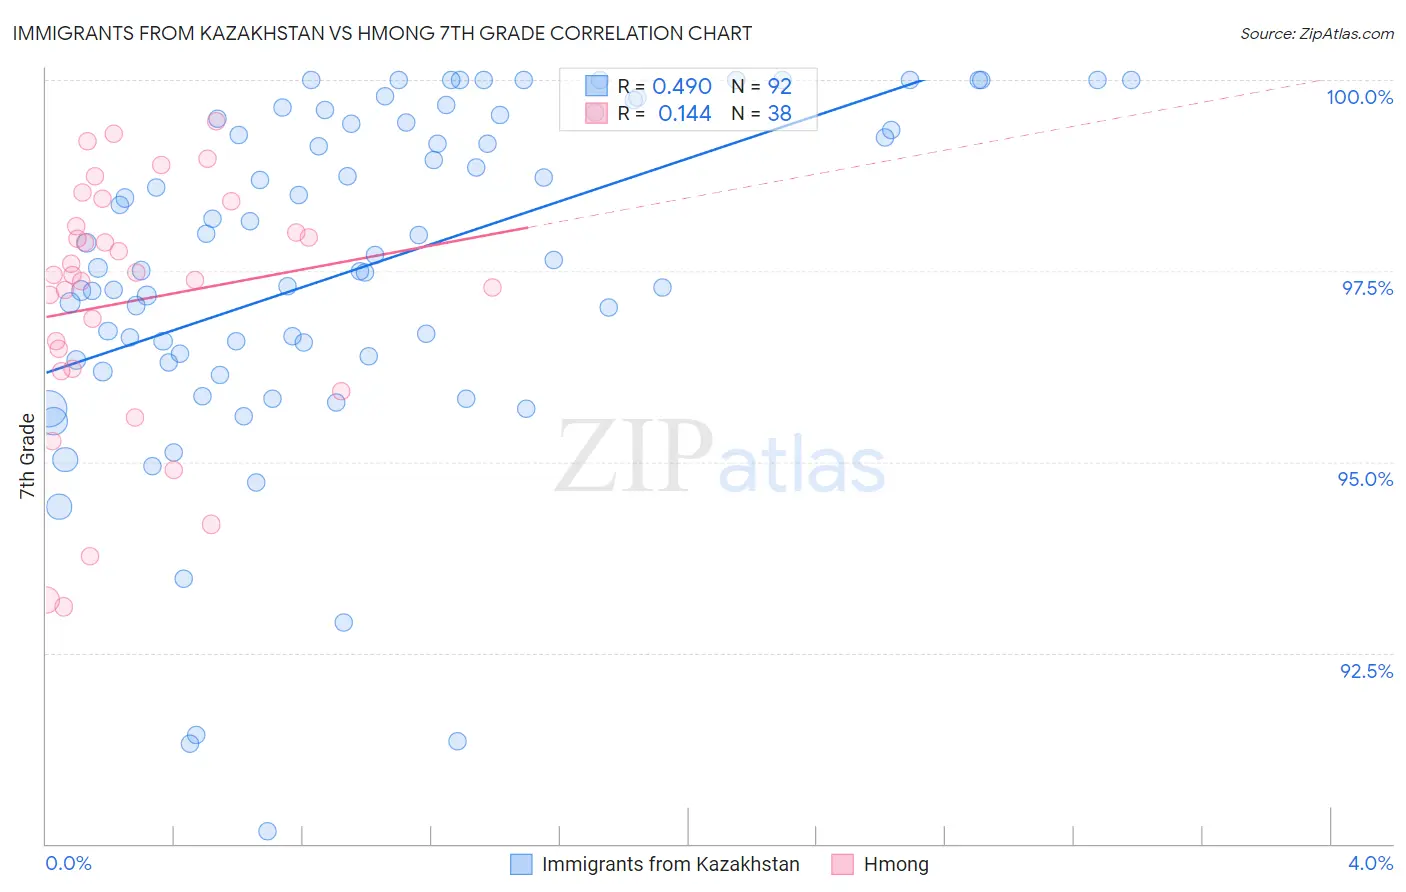
Immigrants from Kazakhstan vs Hmong 7th Grade Correlation Chart
The statistical analysis conducted on geographies consisting of 124,430,097 people shows a moderate positive correlation between the proportion of Immigrants from Kazakhstan and percentage of population with at least 7th grade education in the United States with a correlation coefficient (R) of 0.490 and weighted average of 96.1%. Similarly, the statistical analysis conducted on geographies consisting of 24,672,093 people shows a poor positive correlation between the proportion of Hmong and percentage of population with at least 7th grade education in the United States with a correlation coefficient (R) of 0.144 and weighted average of 96.4%, a difference of 0.29%.
7th Grade Correlation Summary
| Measurement | Immigrants from Kazakhstan | Hmong |
| Minimum | 90.2% | 93.1% |
| Maximum | 100.0% | 99.5% |
| Range | 9.8% | 6.4% |
| Mean | 97.5% | 97.1% |
| Median | 97.7% | 97.4% |
| Interquartile 25% (IQ1) | 96.4% | 96.2% |
| Interquartile 75% (IQ3) | 99.5% | 98.1% |
| Interquartile Range (IQR) | 3.1% | 1.9% |
| Standard Deviation (Sample) | 2.2% | 1.6% |
| Standard Deviation (Population) | 2.2% | 1.6% |
Similar Demographics by 7th Grade
Demographics Similar to Immigrants from Kazakhstan by 7th Grade
In terms of 7th grade, the demographic groups most similar to Immigrants from Kazakhstan are Immigrants from Taiwan (96.1%, a difference of 0.0%), Spaniard (96.1%, a difference of 0.010%), Immigrants from Italy (96.1%, a difference of 0.010%), Immigrants from Sri Lanka (96.1%, a difference of 0.010%), and Immigrants from Poland (96.1%, a difference of 0.010%).
| Demographics | Rating | Rank | 7th Grade |
| Alsatians | 67.2 /100 | #159 | Good 96.1% |
| Immigrants | Kenya | 66.8 /100 | #160 | Good 96.1% |
| Bermudans | 66.3 /100 | #161 | Good 96.1% |
| Pima | 64.3 /100 | #162 | Good 96.1% |
| Spaniards | 62.6 /100 | #163 | Good 96.1% |
| Immigrants | Italy | 62.1 /100 | #164 | Good 96.1% |
| Immigrants | Taiwan | 61.5 /100 | #165 | Good 96.1% |
| Immigrants | Kazakhstan | 61.0 /100 | #166 | Good 96.1% |
| Immigrants | Sri Lanka | 59.9 /100 | #167 | Average 96.1% |
| Immigrants | Poland | 59.0 /100 | #168 | Average 96.1% |
| Ute | 55.8 /100 | #169 | Average 96.1% |
| Immigrants | Ukraine | 55.0 /100 | #170 | Average 96.1% |
| Egyptians | 54.2 /100 | #171 | Average 96.1% |
| Venezuelans | 51.4 /100 | #172 | Average 96.0% |
| Immigrants | Albania | 50.4 /100 | #173 | Average 96.0% |
Demographics Similar to Hmong by 7th Grade
In terms of 7th grade, the demographic groups most similar to Hmong are Filipino (96.4%, a difference of 0.010%), Colville (96.4%, a difference of 0.010%), Soviet Union (96.4%, a difference of 0.010%), Immigrants from Kuwait (96.4%, a difference of 0.010%), and Immigrants from Hungary (96.4%, a difference of 0.020%).
| Demographics | Rating | Rank | 7th Grade |
| Palestinians | 93.5 /100 | #126 | Exceptional 96.4% |
| Immigrants | Bosnia and Herzegovina | 93.3 /100 | #127 | Exceptional 96.4% |
| Immigrants | Romania | 93.2 /100 | #128 | Exceptional 96.4% |
| Immigrants | North Macedonia | 93.1 /100 | #129 | Exceptional 96.4% |
| Immigrants | Serbia | 92.8 /100 | #130 | Exceptional 96.4% |
| Filipinos | 92.1 /100 | #131 | Exceptional 96.4% |
| Colville | 91.7 /100 | #132 | Exceptional 96.4% |
| Hmong | 91.5 /100 | #133 | Exceptional 96.4% |
| Soviet Union | 91.2 /100 | #134 | Exceptional 96.4% |
| Immigrants | Kuwait | 91.1 /100 | #135 | Exceptional 96.4% |
| Immigrants | Hungary | 90.6 /100 | #136 | Exceptional 96.4% |
| Immigrants | Turkey | 90.2 /100 | #137 | Exceptional 96.4% |
| Jordanians | 90.0 /100 | #138 | Excellent 96.4% |
| Basques | 89.3 /100 | #139 | Excellent 96.4% |
| Cambodians | 88.3 /100 | #140 | Excellent 96.3% |