Immigrants from Kazakhstan vs Chinese Unemployment Among Ages 16 to 19 years
COMPARE
Immigrants from Kazakhstan
Chinese
Unemployment Among Ages 16 to 19 years
Unemployment Among Ages 16 to 19 years Comparison
Immigrants from Kazakhstan
Chinese
18.0%
UNEMPLOYMENT AMONG AGES 16 TO 19 YEARS
13.0/ 100
METRIC RATING
216th/ 347
METRIC RANK
16.0%
UNEMPLOYMENT AMONG AGES 16 TO 19 YEARS
99.9/ 100
METRIC RATING
29th/ 347
METRIC RANK
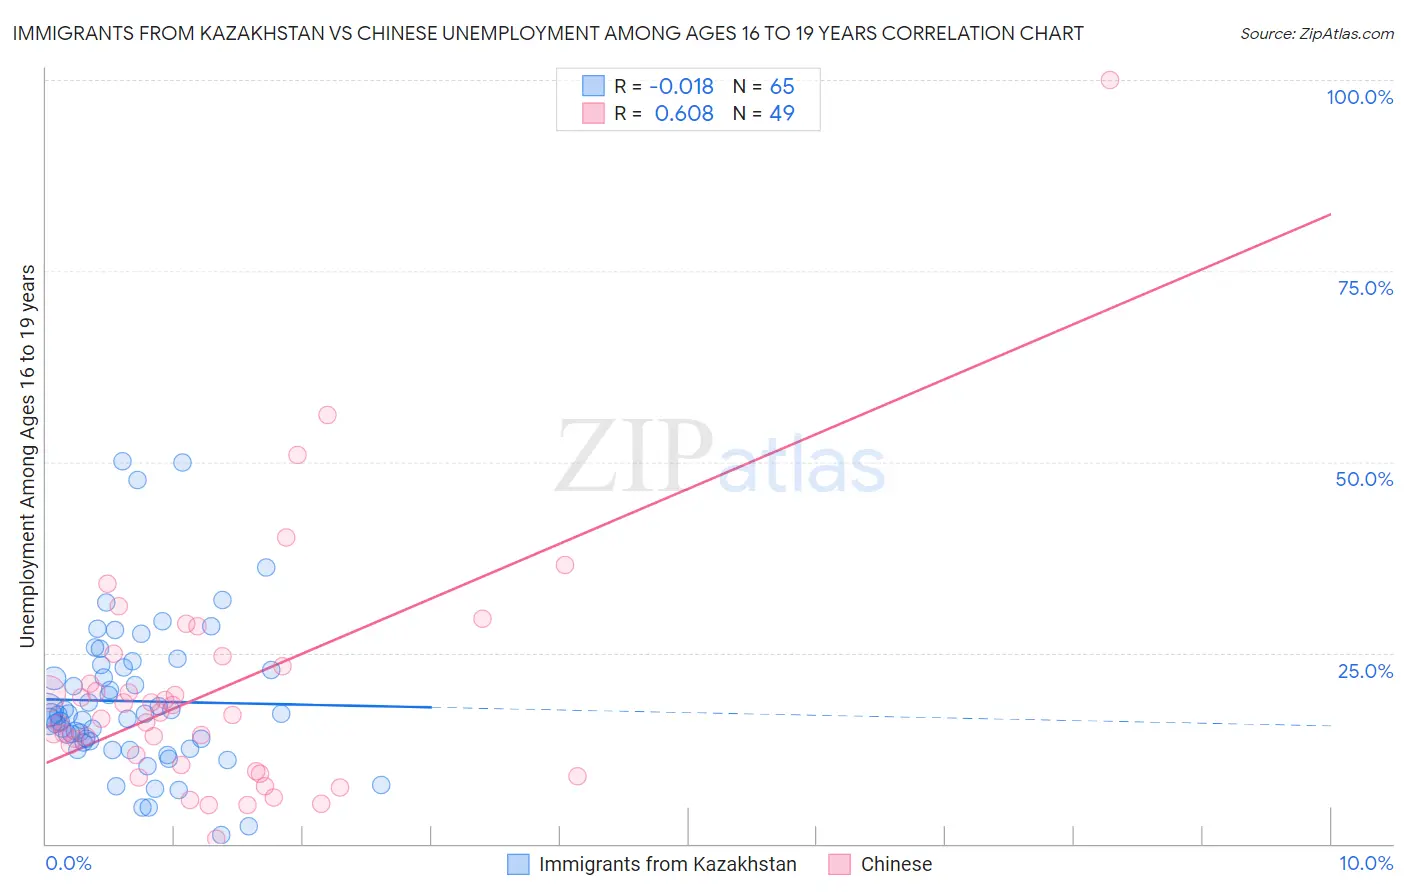
Immigrants from Kazakhstan vs Chinese Unemployment Among Ages 16 to 19 years Correlation Chart
The statistical analysis conducted on geographies consisting of 121,724,453 people shows no correlation between the proportion of Immigrants from Kazakhstan and unemployment rate among population between the ages 16 and 19 in the United States with a correlation coefficient (R) of -0.018 and weighted average of 18.0%. Similarly, the statistical analysis conducted on geographies consisting of 63,869,699 people shows a significant positive correlation between the proportion of Chinese and unemployment rate among population between the ages 16 and 19 in the United States with a correlation coefficient (R) of 0.608 and weighted average of 16.0%, a difference of 12.0%.
Unemployment Among Ages 16 to 19 years Correlation Summary
| Measurement | Immigrants from Kazakhstan | Chinese |
| Minimum | 1.1% | 0.70% |
| Maximum | 50.1% | 100.0% |
| Range | 49.0% | 99.3% |
| Mean | 18.7% | 20.0% |
| Median | 16.9% | 16.8% |
| Interquartile 25% (IQ1) | 12.9% | 9.9% |
| Interquartile 75% (IQ3) | 23.2% | 23.9% |
| Interquartile Range (IQR) | 10.4% | 14.0% |
| Standard Deviation (Sample) | 9.9% | 16.3% |
| Standard Deviation (Population) | 9.8% | 16.1% |
Similar Demographics by Unemployment Among Ages 16 to 19 years
Demographics Similar to Immigrants from Kazakhstan by Unemployment Among Ages 16 to 19 years
In terms of unemployment among ages 16 to 19 years, the demographic groups most similar to Immigrants from Kazakhstan are South American Indian (18.0%, a difference of 0.0%), Immigrants from Syria (18.0%, a difference of 0.030%), Immigrants from Argentina (18.0%, a difference of 0.050%), Immigrants from Morocco (18.0%, a difference of 0.060%), and Chippewa (18.0%, a difference of 0.080%).
| Demographics | Rating | Rank | Unemployment Among Ages 16 to 19 years |
| Cherokee | 15.7 /100 | #209 | Poor 17.9% |
| Carpatho Rusyns | 15.6 /100 | #210 | Poor 17.9% |
| Guamanians/Chamorros | 14.5 /100 | #211 | Poor 17.9% |
| Argentineans | 13.8 /100 | #212 | Poor 18.0% |
| Chippewa | 13.7 /100 | #213 | Poor 18.0% |
| Immigrants | Morocco | 13.5 /100 | #214 | Poor 18.0% |
| Immigrants | Syria | 13.3 /100 | #215 | Poor 18.0% |
| Immigrants | Kazakhstan | 13.0 /100 | #216 | Poor 18.0% |
| South American Indians | 13.0 /100 | #217 | Poor 18.0% |
| Immigrants | Argentina | 12.5 /100 | #218 | Poor 18.0% |
| Immigrants | Africa | 12.0 /100 | #219 | Poor 18.0% |
| Immigrants | Albania | 11.4 /100 | #220 | Poor 18.0% |
| Immigrants | Spain | 11.4 /100 | #221 | Poor 18.0% |
| Immigrants | Iran | 10.7 /100 | #222 | Poor 18.0% |
| Immigrants | Western Asia | 10.2 /100 | #223 | Poor 18.0% |
Demographics Similar to Chinese by Unemployment Among Ages 16 to 19 years
In terms of unemployment among ages 16 to 19 years, the demographic groups most similar to Chinese are Kenyan (16.1%, a difference of 0.040%), Jordanian (16.0%, a difference of 0.050%), English (16.1%, a difference of 0.090%), Immigrants from Sudan (16.0%, a difference of 0.23%), and European (16.1%, a difference of 0.48%).
| Demographics | Rating | Rank | Unemployment Among Ages 16 to 19 years |
| Finns | 100.0 /100 | #22 | Exceptional 15.9% |
| Belgians | 100.0 /100 | #23 | Exceptional 15.9% |
| Tongans | 100.0 /100 | #24 | Exceptional 15.9% |
| Filipinos | 100.0 /100 | #25 | Exceptional 15.9% |
| Dutch | 100.0 /100 | #26 | Exceptional 15.9% |
| Immigrants | Sudan | 99.9 /100 | #27 | Exceptional 16.0% |
| Jordanians | 99.9 /100 | #28 | Exceptional 16.0% |
| Chinese | 99.9 /100 | #29 | Exceptional 16.0% |
| Kenyans | 99.9 /100 | #30 | Exceptional 16.1% |
| English | 99.9 /100 | #31 | Exceptional 16.1% |
| Europeans | 99.9 /100 | #32 | Exceptional 16.1% |
| Immigrants | Kenya | 99.9 /100 | #33 | Exceptional 16.2% |
| Pennsylvania Germans | 99.9 /100 | #34 | Exceptional 16.2% |
| Scottish | 99.8 /100 | #35 | Exceptional 16.2% |
| Immigrants | South Central Asia | 99.8 /100 | #36 | Exceptional 16.2% |