Blackfeet vs Chinese 7th Grade
COMPARE
Blackfeet
Chinese
7th Grade
7th Grade Comparison
Blackfeet
Chinese
96.3%
7TH GRADE
83.9/ 100
METRIC RATING
145th/ 347
METRIC RANK
97.1%
7TH GRADE
99.9/ 100
METRIC RATING
42nd/ 347
METRIC RANK
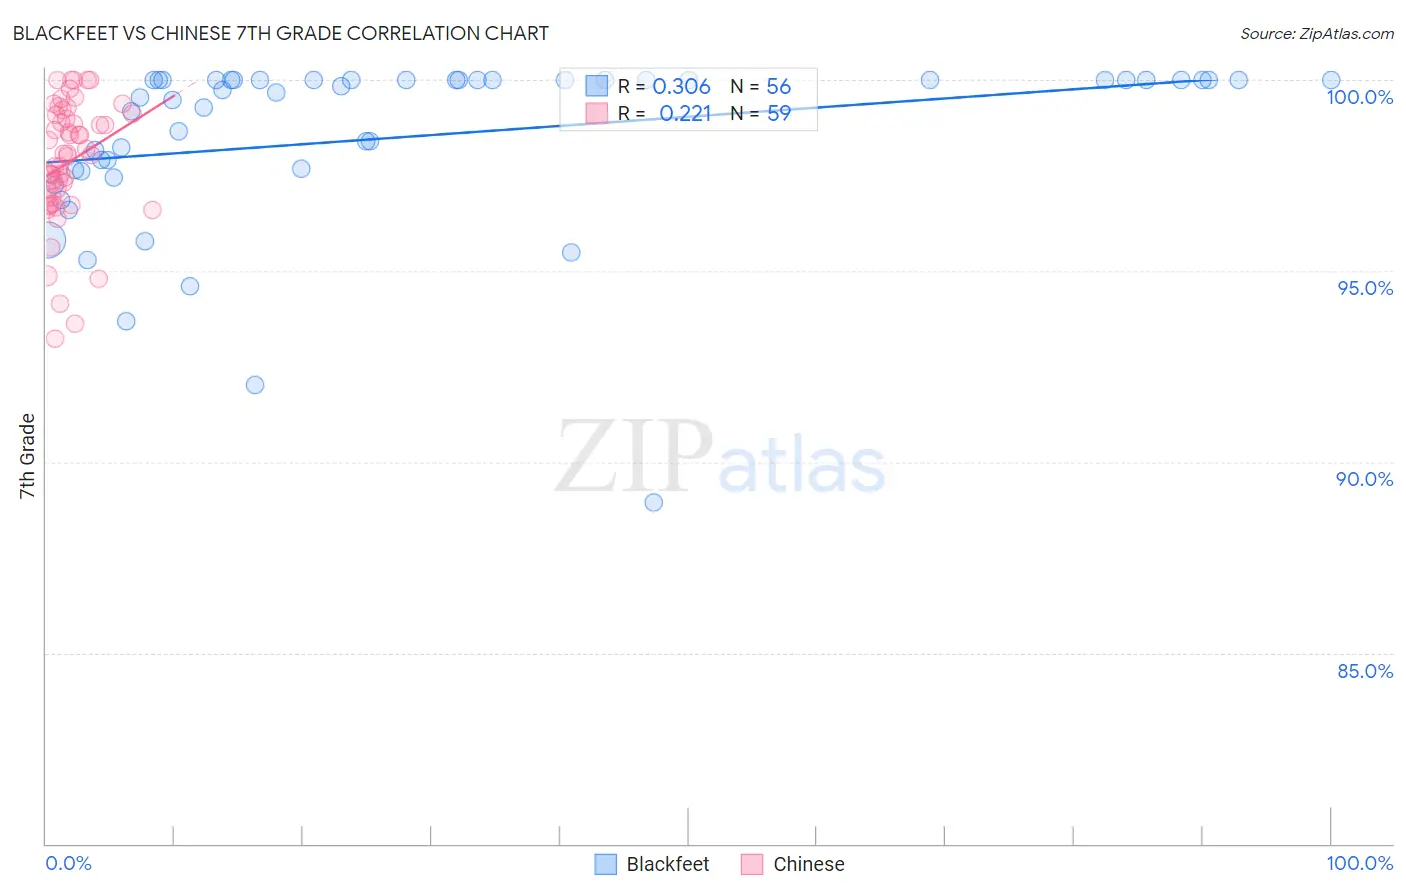
Blackfeet vs Chinese 7th Grade Correlation Chart
The statistical analysis conducted on geographies consisting of 309,580,957 people shows a mild positive correlation between the proportion of Blackfeet and percentage of population with at least 7th grade education in the United States with a correlation coefficient (R) of 0.306 and weighted average of 96.3%. Similarly, the statistical analysis conducted on geographies consisting of 64,809,883 people shows a weak positive correlation between the proportion of Chinese and percentage of population with at least 7th grade education in the United States with a correlation coefficient (R) of 0.221 and weighted average of 97.1%, a difference of 0.89%.
7th Grade Correlation Summary
| Measurement | Blackfeet | Chinese |
| Minimum | 88.9% | 93.2% |
| Maximum | 100.0% | 100.0% |
| Range | 11.1% | 6.8% |
| Mean | 98.5% | 97.8% |
| Median | 99.8% | 98.0% |
| Interquartile 25% (IQ1) | 97.7% | 96.9% |
| Interquartile 75% (IQ3) | 100.0% | 99.1% |
| Interquartile Range (IQR) | 2.3% | 2.2% |
| Standard Deviation (Sample) | 2.3% | 1.6% |
| Standard Deviation (Population) | 2.3% | 1.6% |
Similar Demographics by 7th Grade
Demographics Similar to Blackfeet by 7th Grade
In terms of 7th grade, the demographic groups most similar to Blackfeet are Immigrants from Eastern Europe (96.3%, a difference of 0.0%), French American Indian (96.3%, a difference of 0.010%), Israeli (96.3%, a difference of 0.010%), Albanian (96.3%, a difference of 0.010%), and Immigrants from Greece (96.3%, a difference of 0.020%).
| Demographics | Rating | Rank | 7th Grade |
| Jordanians | 90.0 /100 | #138 | Excellent 96.4% |
| Basques | 89.3 /100 | #139 | Excellent 96.4% |
| Cambodians | 88.3 /100 | #140 | Excellent 96.3% |
| Immigrants | South Central Asia | 87.1 /100 | #141 | Excellent 96.3% |
| Burmese | 87.1 /100 | #142 | Excellent 96.3% |
| Spanish | 86.6 /100 | #143 | Excellent 96.3% |
| Immigrants | Greece | 85.9 /100 | #144 | Excellent 96.3% |
| Blackfeet | 83.9 /100 | #145 | Excellent 96.3% |
| Immigrants | Eastern Europe | 83.7 /100 | #146 | Excellent 96.3% |
| French American Indians | 83.1 /100 | #147 | Excellent 96.3% |
| Israelis | 82.8 /100 | #148 | Excellent 96.3% |
| Albanians | 82.6 /100 | #149 | Excellent 96.3% |
| Immigrants | Belarus | 82.4 /100 | #150 | Excellent 96.3% |
| Hopi | 81.6 /100 | #151 | Excellent 96.3% |
| Immigrants | Russia | 78.4 /100 | #152 | Good 96.2% |
Demographics Similar to Chinese by 7th Grade
In terms of 7th grade, the demographic groups most similar to Chinese are Maltese (97.1%, a difference of 0.030%), Eastern European (97.2%, a difference of 0.040%), Northern European (97.1%, a difference of 0.040%), Czechoslovakian (97.1%, a difference of 0.040%), and Aleut (97.1%, a difference of 0.050%).
| Demographics | Rating | Rank | 7th Grade |
| Swiss | 100.0 /100 | #35 | Exceptional 97.3% |
| Hungarians | 100.0 /100 | #36 | Exceptional 97.2% |
| British | 100.0 /100 | #37 | Exceptional 97.2% |
| Belgians | 100.0 /100 | #38 | Exceptional 97.2% |
| Latvians | 100.0 /100 | #39 | Exceptional 97.2% |
| Luxembourgers | 100.0 /100 | #40 | Exceptional 97.2% |
| Eastern Europeans | 100.0 /100 | #41 | Exceptional 97.2% |
| Chinese | 99.9 /100 | #42 | Exceptional 97.1% |
| Maltese | 99.9 /100 | #43 | Exceptional 97.1% |
| Northern Europeans | 99.9 /100 | #44 | Exceptional 97.1% |
| Czechoslovakians | 99.9 /100 | #45 | Exceptional 97.1% |
| Aleuts | 99.9 /100 | #46 | Exceptional 97.1% |
| Bulgarians | 99.9 /100 | #47 | Exceptional 97.1% |
| Celtics | 99.9 /100 | #48 | Exceptional 97.1% |
| Slavs | 99.9 /100 | #49 | Exceptional 97.1% |