Immigrants from Kazakhstan vs Nicaraguan 7th Grade
COMPARE
Immigrants from Kazakhstan
Nicaraguan
7th Grade
7th Grade Comparison
Immigrants from Kazakhstan
Nicaraguans
96.1%
7TH GRADE
61.0/ 100
METRIC RATING
166th/ 347
METRIC RANK
93.5%
7TH GRADE
0.0/ 100
METRIC RATING
322nd/ 347
METRIC RANK
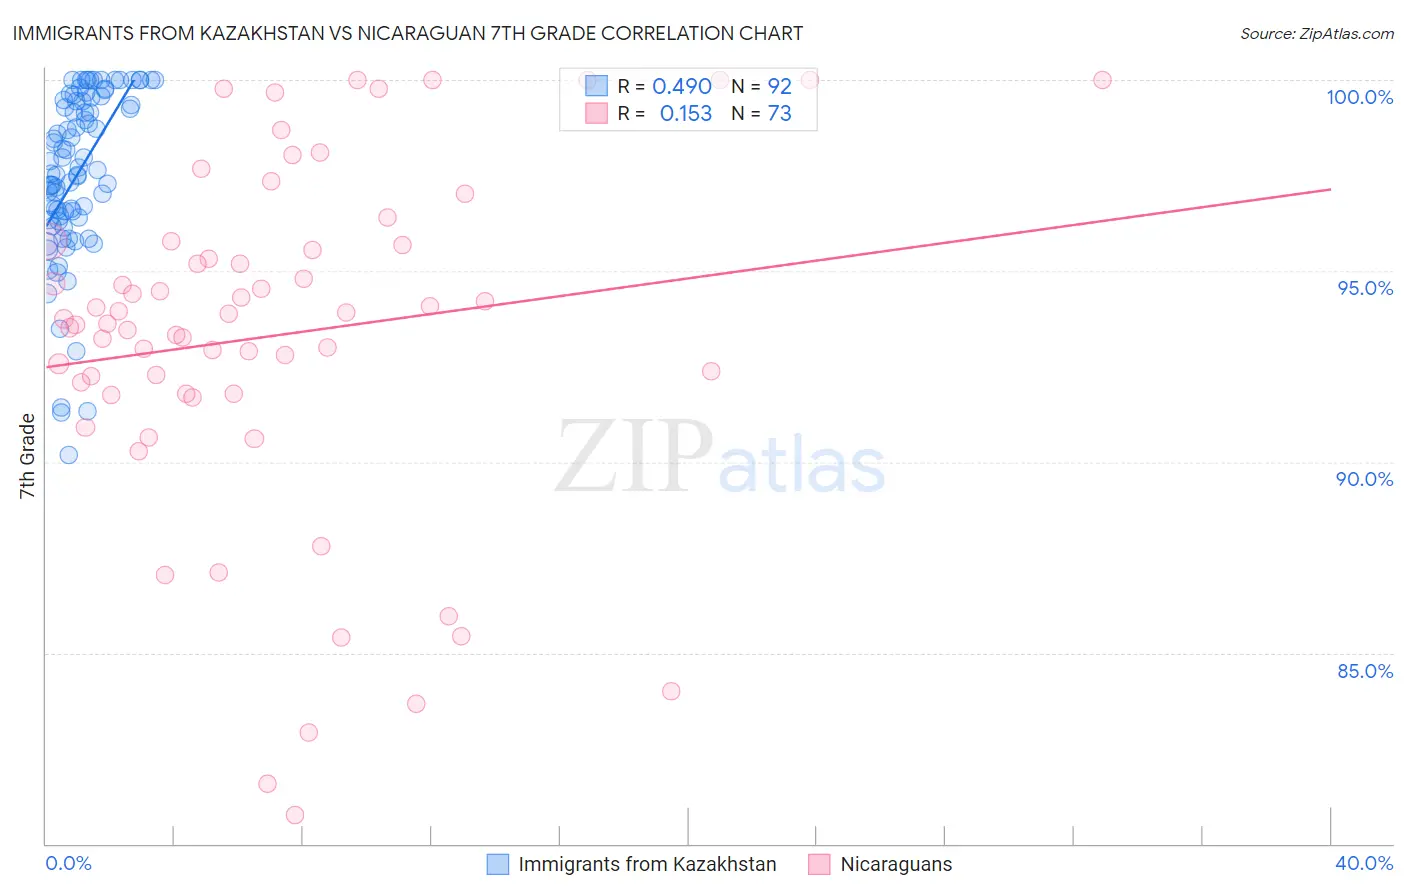
Immigrants from Kazakhstan vs Nicaraguan 7th Grade Correlation Chart
The statistical analysis conducted on geographies consisting of 124,430,097 people shows a moderate positive correlation between the proportion of Immigrants from Kazakhstan and percentage of population with at least 7th grade education in the United States with a correlation coefficient (R) of 0.490 and weighted average of 96.1%. Similarly, the statistical analysis conducted on geographies consisting of 285,711,651 people shows a poor positive correlation between the proportion of Nicaraguans and percentage of population with at least 7th grade education in the United States with a correlation coefficient (R) of 0.153 and weighted average of 93.5%, a difference of 2.8%.
7th Grade Correlation Summary
| Measurement | Immigrants from Kazakhstan | Nicaraguan |
| Minimum | 90.2% | 80.8% |
| Maximum | 100.0% | 100.0% |
| Range | 9.8% | 19.2% |
| Mean | 97.5% | 93.3% |
| Median | 97.7% | 93.7% |
| Interquartile 25% (IQ1) | 96.4% | 91.8% |
| Interquartile 75% (IQ3) | 99.5% | 95.7% |
| Interquartile Range (IQR) | 3.1% | 3.9% |
| Standard Deviation (Sample) | 2.2% | 4.5% |
| Standard Deviation (Population) | 2.2% | 4.5% |
Similar Demographics by 7th Grade
Demographics Similar to Immigrants from Kazakhstan by 7th Grade
In terms of 7th grade, the demographic groups most similar to Immigrants from Kazakhstan are Immigrants from Taiwan (96.1%, a difference of 0.0%), Spaniard (96.1%, a difference of 0.010%), Immigrants from Italy (96.1%, a difference of 0.010%), Immigrants from Sri Lanka (96.1%, a difference of 0.010%), and Immigrants from Poland (96.1%, a difference of 0.010%).
| Demographics | Rating | Rank | 7th Grade |
| Alsatians | 67.2 /100 | #159 | Good 96.1% |
| Immigrants | Kenya | 66.8 /100 | #160 | Good 96.1% |
| Bermudans | 66.3 /100 | #161 | Good 96.1% |
| Pima | 64.3 /100 | #162 | Good 96.1% |
| Spaniards | 62.6 /100 | #163 | Good 96.1% |
| Immigrants | Italy | 62.1 /100 | #164 | Good 96.1% |
| Immigrants | Taiwan | 61.5 /100 | #165 | Good 96.1% |
| Immigrants | Kazakhstan | 61.0 /100 | #166 | Good 96.1% |
| Immigrants | Sri Lanka | 59.9 /100 | #167 | Average 96.1% |
| Immigrants | Poland | 59.0 /100 | #168 | Average 96.1% |
| Ute | 55.8 /100 | #169 | Average 96.1% |
| Immigrants | Ukraine | 55.0 /100 | #170 | Average 96.1% |
| Egyptians | 54.2 /100 | #171 | Average 96.1% |
| Venezuelans | 51.4 /100 | #172 | Average 96.0% |
| Immigrants | Albania | 50.4 /100 | #173 | Average 96.0% |
Demographics Similar to Nicaraguans by 7th Grade
In terms of 7th grade, the demographic groups most similar to Nicaraguans are Belizean (93.5%, a difference of 0.040%), Immigrants from Fiji (93.5%, a difference of 0.080%), Immigrants from Belize (93.4%, a difference of 0.11%), Dominican (93.3%, a difference of 0.13%), and Central American Indian (93.3%, a difference of 0.20%).
| Demographics | Rating | Rank | 7th Grade |
| Vietnamese | 0.0 /100 | #315 | Tragic 93.9% |
| Immigrants | Vietnam | 0.0 /100 | #316 | Tragic 93.9% |
| Immigrants | Cuba | 0.0 /100 | #317 | Tragic 93.8% |
| Immigrants | Ecuador | 0.0 /100 | #318 | Tragic 93.7% |
| Immigrants | Cambodia | 0.0 /100 | #319 | Tragic 93.7% |
| Immigrants | Fiji | 0.0 /100 | #320 | Tragic 93.5% |
| Belizeans | 0.0 /100 | #321 | Tragic 93.5% |
| Nicaraguans | 0.0 /100 | #322 | Tragic 93.5% |
| Immigrants | Belize | 0.0 /100 | #323 | Tragic 93.4% |
| Dominicans | 0.0 /100 | #324 | Tragic 93.3% |
| Central American Indians | 0.0 /100 | #325 | Tragic 93.3% |
| Nepalese | 0.0 /100 | #326 | Tragic 93.2% |
| Immigrants | Cabo Verde | 0.0 /100 | #327 | Tragic 93.1% |
| Immigrants | Nicaragua | 0.0 /100 | #328 | Tragic 93.0% |
| Immigrants | Azores | 0.0 /100 | #329 | Tragic 93.0% |