Immigrants from Jordan vs Immigrants from South Eastern Asia Doctorate Degree
COMPARE
Immigrants from Jordan
Immigrants from South Eastern Asia
Doctorate Degree
Doctorate Degree Comparison
Immigrants from Jordan
Immigrants from South Eastern Asia
2.0%
DOCTORATE DEGREE
94.8/ 100
METRIC RATING
121st/ 347
METRIC RANK
1.7%
DOCTORATE DEGREE
14.7/ 100
METRIC RATING
212th/ 347
METRIC RANK
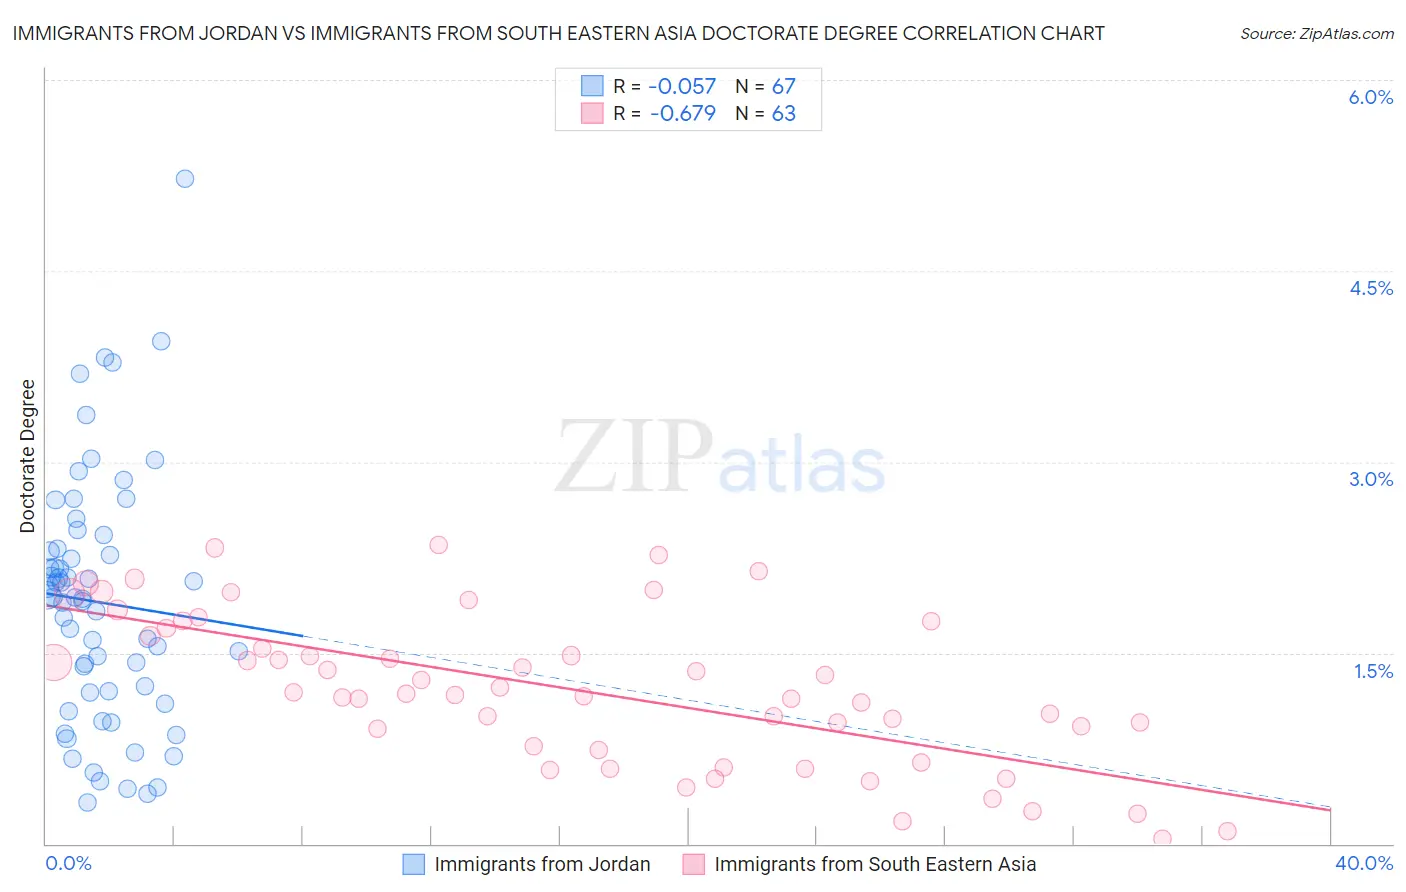
Immigrants from Jordan vs Immigrants from South Eastern Asia Doctorate Degree Correlation Chart
The statistical analysis conducted on geographies consisting of 180,883,250 people shows a slight negative correlation between the proportion of Immigrants from Jordan and percentage of population with at least doctorate degree education in the United States with a correlation coefficient (R) of -0.057 and weighted average of 2.0%. Similarly, the statistical analysis conducted on geographies consisting of 502,144,832 people shows a significant negative correlation between the proportion of Immigrants from South Eastern Asia and percentage of population with at least doctorate degree education in the United States with a correlation coefficient (R) of -0.679 and weighted average of 1.7%, a difference of 18.2%.
Doctorate Degree Correlation Summary
| Measurement | Immigrants from Jordan | Immigrants from South Eastern Asia |
| Minimum | 0.32% | 0.043% |
| Maximum | 5.2% | 2.3% |
| Range | 4.9% | 2.3% |
| Mean | 1.9% | 1.2% |
| Median | 1.9% | 1.2% |
| Interquartile 25% (IQ1) | 1.2% | 0.74% |
| Interquartile 75% (IQ3) | 2.3% | 1.7% |
| Interquartile Range (IQR) | 1.1% | 0.96% |
| Standard Deviation (Sample) | 0.98% | 0.60% |
| Standard Deviation (Population) | 0.97% | 0.59% |
Similar Demographics by Doctorate Degree
Demographics Similar to Immigrants from Jordan by Doctorate Degree
In terms of doctorate degree, the demographic groups most similar to Immigrants from Jordan are Immigrants from Southern Europe (2.0%, a difference of 0.030%), Immigrants from Morocco (2.0%, a difference of 0.48%), Croatian (2.0%, a difference of 0.48%), Pakistani (2.0%, a difference of 0.76%), and Icelander (2.1%, a difference of 0.90%).
| Demographics | Rating | Rank | Doctorate Degree |
| Immigrants | Croatia | 96.8 /100 | #114 | Exceptional 2.1% |
| Taiwanese | 96.7 /100 | #115 | Exceptional 2.1% |
| Maltese | 96.2 /100 | #116 | Exceptional 2.1% |
| Lebanese | 96.0 /100 | #117 | Exceptional 2.1% |
| Icelanders | 96.0 /100 | #118 | Exceptional 2.1% |
| Pakistanis | 95.8 /100 | #119 | Exceptional 2.0% |
| Immigrants | Morocco | 95.5 /100 | #120 | Exceptional 2.0% |
| Immigrants | Jordan | 94.8 /100 | #121 | Exceptional 2.0% |
| Immigrants | Southern Europe | 94.7 /100 | #122 | Exceptional 2.0% |
| Croatians | 94.0 /100 | #123 | Exceptional 2.0% |
| Ute | 93.2 /100 | #124 | Exceptional 2.0% |
| Moroccans | 93.0 /100 | #125 | Exceptional 2.0% |
| Jordanians | 92.1 /100 | #126 | Exceptional 2.0% |
| Palestinians | 92.0 /100 | #127 | Exceptional 2.0% |
| Immigrants | Zaire | 91.1 /100 | #128 | Exceptional 2.0% |
Demographics Similar to Immigrants from South Eastern Asia by Doctorate Degree
In terms of doctorate degree, the demographic groups most similar to Immigrants from South Eastern Asia are Immigrants from Armenia (1.7%, a difference of 0.13%), Tongan (1.7%, a difference of 0.14%), Korean (1.7%, a difference of 0.15%), Pueblo (1.7%, a difference of 0.15%), and Immigrants from Western Africa (1.7%, a difference of 0.22%).
| Demographics | Rating | Rank | Doctorate Degree |
| Venezuelans | 19.5 /100 | #205 | Poor 1.7% |
| Immigrants | Peru | 17.6 /100 | #206 | Poor 1.7% |
| Yugoslavians | 17.1 /100 | #207 | Poor 1.7% |
| Colombians | 16.1 /100 | #208 | Poor 1.7% |
| Immigrants | Western Africa | 15.4 /100 | #209 | Poor 1.7% |
| Tongans | 15.1 /100 | #210 | Poor 1.7% |
| Immigrants | Armenia | 15.1 /100 | #211 | Poor 1.7% |
| Immigrants | South Eastern Asia | 14.7 /100 | #212 | Poor 1.7% |
| Koreans | 14.2 /100 | #213 | Poor 1.7% |
| Pueblo | 14.2 /100 | #214 | Poor 1.7% |
| Alaskan Athabascans | 13.8 /100 | #215 | Poor 1.7% |
| Immigrants | Burma/Myanmar | 13.5 /100 | #216 | Poor 1.7% |
| Spanish Americans | 12.9 /100 | #217 | Poor 1.7% |
| Tlingit-Haida | 11.9 /100 | #218 | Poor 1.7% |
| Immigrants | Iraq | 10.7 /100 | #219 | Poor 1.7% |