Immigrants from Jordan vs Immigrants from Uzbekistan Professional Degree
COMPARE
Immigrants from Jordan
Immigrants from Uzbekistan
Professional Degree
Professional Degree Comparison
Immigrants from Jordan
Immigrants from Uzbekistan
4.7%
PROFESSIONAL DEGREE
89.0/ 100
METRIC RATING
136th/ 347
METRIC RANK
5.2%
PROFESSIONAL DEGREE
99.2/ 100
METRIC RATING
96th/ 347
METRIC RANK
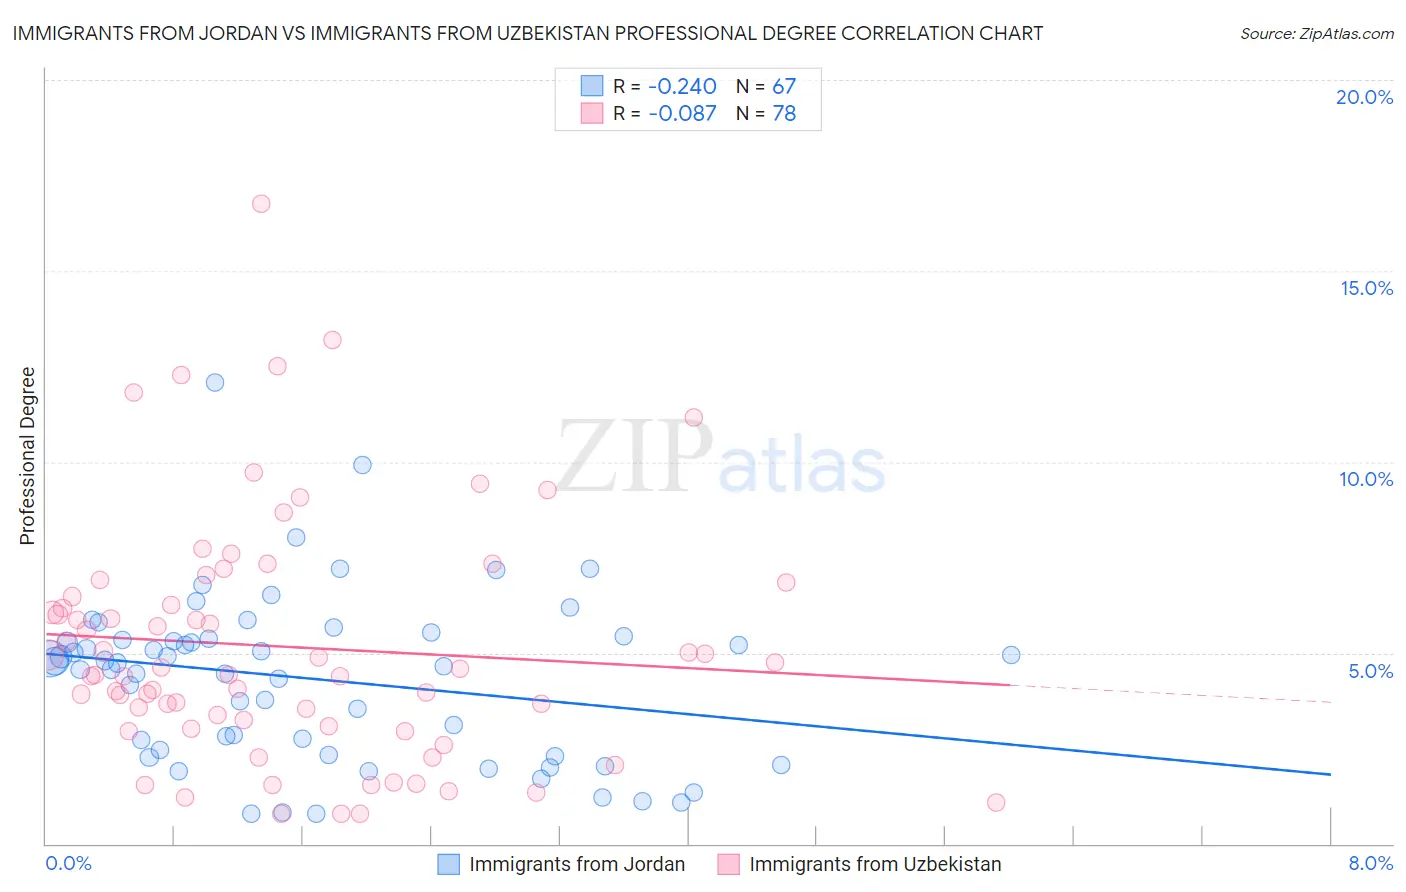
Immigrants from Jordan vs Immigrants from Uzbekistan Professional Degree Correlation Chart
The statistical analysis conducted on geographies consisting of 181,207,103 people shows a weak negative correlation between the proportion of Immigrants from Jordan and percentage of population with at least professional degree education in the United States with a correlation coefficient (R) of -0.240 and weighted average of 4.7%. Similarly, the statistical analysis conducted on geographies consisting of 118,716,949 people shows a slight negative correlation between the proportion of Immigrants from Uzbekistan and percentage of population with at least professional degree education in the United States with a correlation coefficient (R) of -0.087 and weighted average of 5.2%, a difference of 9.2%.
Professional Degree Correlation Summary
| Measurement | Immigrants from Jordan | Immigrants from Uzbekistan |
| Minimum | 0.78% | 0.78% |
| Maximum | 12.1% | 16.8% |
| Range | 11.3% | 16.0% |
| Mean | 4.3% | 5.2% |
| Median | 4.7% | 4.5% |
| Interquartile 25% (IQ1) | 2.3% | 3.1% |
| Interquartile 75% (IQ3) | 5.4% | 6.5% |
| Interquartile Range (IQR) | 3.1% | 3.4% |
| Standard Deviation (Sample) | 2.2% | 3.2% |
| Standard Deviation (Population) | 2.2% | 3.2% |
Similar Demographics by Professional Degree
Demographics Similar to Immigrants from Jordan by Professional Degree
In terms of professional degree, the demographic groups most similar to Immigrants from Jordan are Jordanian (4.7%, a difference of 0.020%), Afghan (4.7%, a difference of 0.060%), Macedonian (4.8%, a difference of 0.28%), South American Indian (4.8%, a difference of 0.31%), and Italian (4.8%, a difference of 0.44%).
| Demographics | Rating | Rank | Professional Degree |
| Palestinians | 91.5 /100 | #129 | Exceptional 4.8% |
| Icelanders | 91.5 /100 | #130 | Exceptional 4.8% |
| Immigrants | Nepal | 91.4 /100 | #131 | Exceptional 4.8% |
| Pakistanis | 90.9 /100 | #132 | Exceptional 4.8% |
| Italians | 90.2 /100 | #133 | Exceptional 4.8% |
| South American Indians | 89.9 /100 | #134 | Excellent 4.8% |
| Macedonians | 89.8 /100 | #135 | Excellent 4.8% |
| Immigrants | Jordan | 89.0 /100 | #136 | Excellent 4.7% |
| Jordanians | 88.9 /100 | #137 | Excellent 4.7% |
| Afghans | 88.8 /100 | #138 | Excellent 4.7% |
| South Americans | 85.6 /100 | #139 | Excellent 4.7% |
| Canadians | 84.4 /100 | #140 | Excellent 4.7% |
| Basques | 81.8 /100 | #141 | Excellent 4.6% |
| Sudanese | 81.3 /100 | #142 | Excellent 4.6% |
| Hungarians | 80.8 /100 | #143 | Excellent 4.6% |
Demographics Similar to Immigrants from Uzbekistan by Professional Degree
In terms of professional degree, the demographic groups most similar to Immigrants from Uzbekistan are Syrian (5.2%, a difference of 0.35%), Austrian (5.2%, a difference of 0.37%), Zimbabwean (5.2%, a difference of 0.41%), Immigrants from Italy (5.2%, a difference of 0.43%), and Alsatian (5.2%, a difference of 0.59%).
| Demographics | Rating | Rank | Professional Degree |
| Chileans | 99.5 /100 | #89 | Exceptional 5.3% |
| Immigrants | Scotland | 99.5 /100 | #90 | Exceptional 5.3% |
| Laotians | 99.5 /100 | #91 | Exceptional 5.2% |
| Immigrants | Eastern Europe | 99.5 /100 | #92 | Exceptional 5.2% |
| Northern Europeans | 99.3 /100 | #93 | Exceptional 5.2% |
| Alsatians | 99.3 /100 | #94 | Exceptional 5.2% |
| Zimbabweans | 99.3 /100 | #95 | Exceptional 5.2% |
| Immigrants | Uzbekistan | 99.2 /100 | #96 | Exceptional 5.2% |
| Syrians | 99.1 /100 | #97 | Exceptional 5.2% |
| Austrians | 99.1 /100 | #98 | Exceptional 5.2% |
| Immigrants | Italy | 99.1 /100 | #99 | Exceptional 5.2% |
| Ugandans | 98.8 /100 | #100 | Exceptional 5.1% |
| Immigrants | Egypt | 98.5 /100 | #101 | Exceptional 5.1% |
| Ukrainians | 98.5 /100 | #102 | Exceptional 5.1% |
| Immigrants | Northern Africa | 98.4 /100 | #103 | Exceptional 5.1% |