Immigrants from Japan vs Yup'ik 4th Grade
COMPARE
Immigrants from Japan
Yup'ik
4th Grade
4th Grade Comparison
Immigrants from Japan
Yup'ik
97.8%
4TH GRADE
94.1/ 100
METRIC RATING
122nd/ 347
METRIC RANK
98.5%
4TH GRADE
100.0/ 100
METRIC RATING
5th/ 347
METRIC RANK
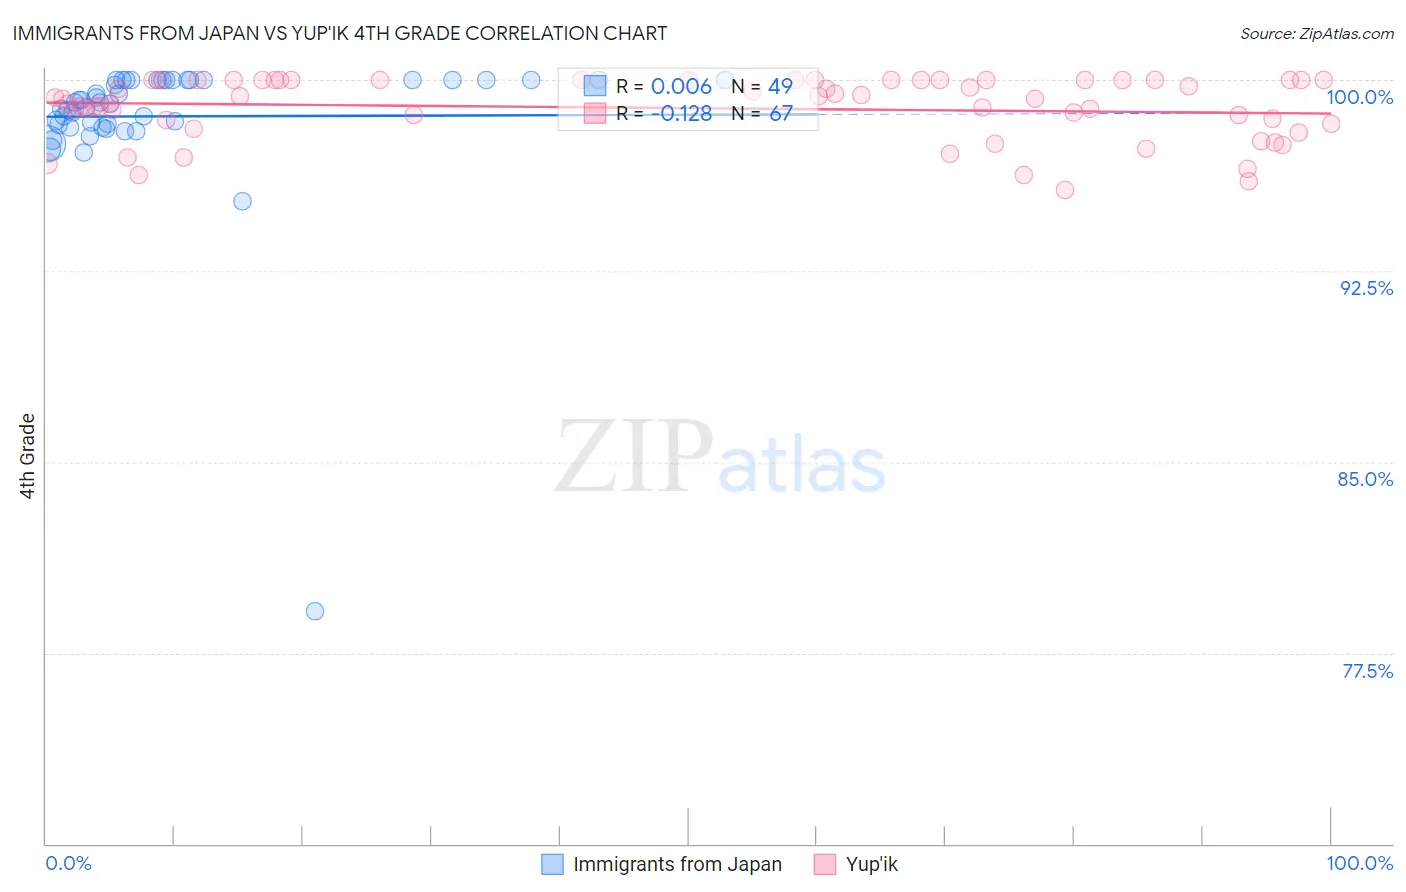
Immigrants from Japan vs Yup'ik 4th Grade Correlation Chart
The statistical analysis conducted on geographies consisting of 340,148,942 people shows no correlation between the proportion of Immigrants from Japan and percentage of population with at least 4th grade education in the United States with a correlation coefficient (R) of 0.006 and weighted average of 97.8%. Similarly, the statistical analysis conducted on geographies consisting of 39,964,464 people shows a poor negative correlation between the proportion of Yup'ik and percentage of population with at least 4th grade education in the United States with a correlation coefficient (R) of -0.128 and weighted average of 98.5%, a difference of 0.78%.
4th Grade Correlation Summary
| Measurement | Immigrants from Japan | Yup'ik |
| Minimum | 79.1% | 95.7% |
| Maximum | 100.0% | 100.0% |
| Range | 20.9% | 4.3% |
| Mean | 98.6% | 98.9% |
| Median | 99.1% | 99.3% |
| Interquartile 25% (IQ1) | 98.2% | 98.3% |
| Interquartile 75% (IQ3) | 100.0% | 100.0% |
| Interquartile Range (IQR) | 1.8% | 1.7% |
| Standard Deviation (Sample) | 3.0% | 1.2% |
| Standard Deviation (Population) | 3.0% | 1.2% |
Similar Demographics by 4th Grade
Demographics Similar to Immigrants from Japan by 4th Grade
In terms of 4th grade, the demographic groups most similar to Immigrants from Japan are Immigrants from Norway (97.8%, a difference of 0.0%), Immigrants from Zimbabwe (97.8%, a difference of 0.0%), Syrian (97.8%, a difference of 0.010%), Menominee (97.8%, a difference of 0.010%), and Immigrants from Saudi Arabia (97.8%, a difference of 0.010%).
| Demographics | Rating | Rank | 4th Grade |
| Lebanese | 95.4 /100 | #115 | Exceptional 97.8% |
| Immigrants | Croatia | 95.2 /100 | #116 | Exceptional 97.8% |
| Syrians | 94.9 /100 | #117 | Exceptional 97.8% |
| Menominee | 94.9 /100 | #118 | Exceptional 97.8% |
| Immigrants | Saudi Arabia | 94.8 /100 | #119 | Exceptional 97.8% |
| Immigrants | France | 94.8 /100 | #120 | Exceptional 97.8% |
| Immigrants | Norway | 94.2 /100 | #121 | Exceptional 97.8% |
| Immigrants | Japan | 94.1 /100 | #122 | Exceptional 97.8% |
| Immigrants | Zimbabwe | 93.9 /100 | #123 | Exceptional 97.8% |
| Spanish | 93.7 /100 | #124 | Exceptional 97.8% |
| Immigrants | Serbia | 92.6 /100 | #125 | Exceptional 97.8% |
| Immigrants | Europe | 92.5 /100 | #126 | Exceptional 97.8% |
| Colville | 92.3 /100 | #127 | Exceptional 97.7% |
| Pima | 92.0 /100 | #128 | Exceptional 97.7% |
| Immigrants | Bulgaria | 91.3 /100 | #129 | Exceptional 97.7% |
Demographics Similar to Yup'ik by 4th Grade
In terms of 4th grade, the demographic groups most similar to Yup'ik are Inupiat (98.6%, a difference of 0.030%), Norwegian (98.5%, a difference of 0.030%), Slovak (98.5%, a difference of 0.050%), German (98.5%, a difference of 0.050%), and Tsimshian (98.6%, a difference of 0.090%).
| Demographics | Rating | Rank | 4th Grade |
| Crow | 100.0 /100 | #1 | Exceptional 99.6% |
| Welsh | 100.0 /100 | #2 | Exceptional 98.7% |
| Tsimshian | 100.0 /100 | #3 | Exceptional 98.6% |
| Inupiat | 100.0 /100 | #4 | Exceptional 98.6% |
| Yup'ik | 100.0 /100 | #5 | Exceptional 98.5% |
| Norwegians | 100.0 /100 | #6 | Exceptional 98.5% |
| Slovaks | 100.0 /100 | #7 | Exceptional 98.5% |
| Germans | 100.0 /100 | #8 | Exceptional 98.5% |
| Slovenes | 100.0 /100 | #9 | Exceptional 98.4% |
| Alaskan Athabascans | 100.0 /100 | #10 | Exceptional 98.4% |
| English | 100.0 /100 | #11 | Exceptional 98.4% |
| Tlingit-Haida | 100.0 /100 | #12 | Exceptional 98.4% |
| Swedes | 100.0 /100 | #13 | Exceptional 98.4% |
| Carpatho Rusyns | 100.0 /100 | #14 | Exceptional 98.4% |
| Dutch | 100.0 /100 | #15 | Exceptional 98.4% |