Immigrants from Japan vs Serbian Nursery School
COMPARE
Immigrants from Japan
Serbian
Nursery School
Nursery School Comparison
Immigrants from Japan
Serbians
98.2%
NURSERY SCHOOL
94.0/ 100
METRIC RATING
122nd/ 347
METRIC RANK
98.4%
NURSERY SCHOOL
99.6/ 100
METRIC RATING
71st/ 347
METRIC RANK
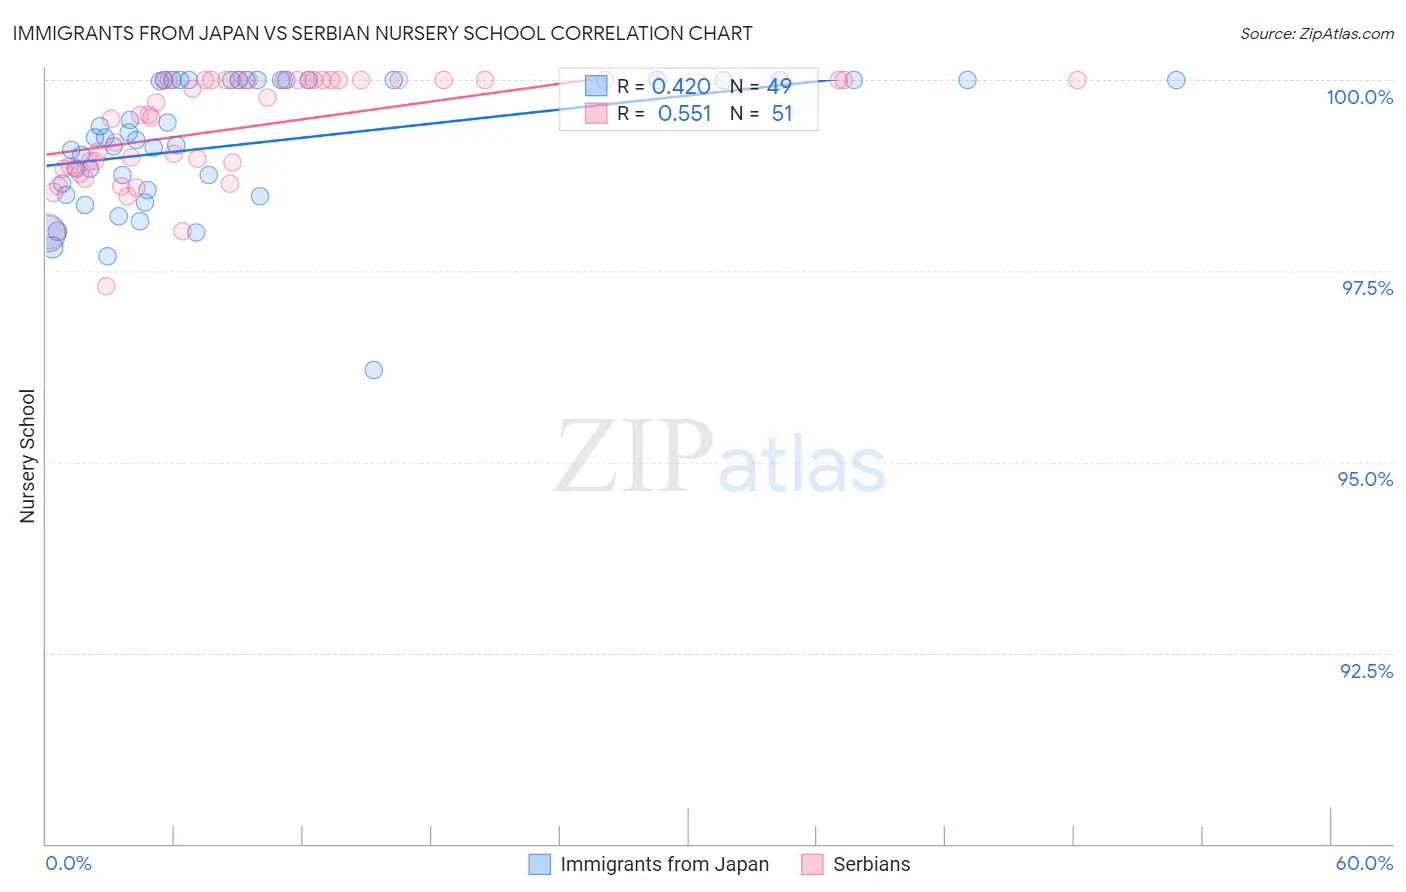
Immigrants from Japan vs Serbian Nursery School Correlation Chart
The statistical analysis conducted on geographies consisting of 340,149,128 people shows a moderate positive correlation between the proportion of Immigrants from Japan and percentage of population with at least nursery school education in the United States with a correlation coefficient (R) of 0.420 and weighted average of 98.2%. Similarly, the statistical analysis conducted on geographies consisting of 267,642,942 people shows a substantial positive correlation between the proportion of Serbians and percentage of population with at least nursery school education in the United States with a correlation coefficient (R) of 0.551 and weighted average of 98.4%, a difference of 0.21%.
Nursery School Correlation Summary
| Measurement | Immigrants from Japan | Serbian |
| Minimum | 96.2% | 97.3% |
| Maximum | 100.0% | 100.0% |
| Range | 3.8% | 2.7% |
| Mean | 99.2% | 99.4% |
| Median | 99.2% | 99.5% |
| Interquartile 25% (IQ1) | 98.5% | 98.8% |
| Interquartile 75% (IQ3) | 100.0% | 100.0% |
| Interquartile Range (IQR) | 1.5% | 1.2% |
| Standard Deviation (Sample) | 0.86% | 0.69% |
| Standard Deviation (Population) | 0.85% | 0.68% |
Similar Demographics by Nursery School
Demographics Similar to Immigrants from Japan by Nursery School
In terms of nursery school, the demographic groups most similar to Immigrants from Japan are Immigrants from Zimbabwe (98.2%, a difference of 0.0%), Syrian (98.2%, a difference of 0.0%), Lebanese (98.2%, a difference of 0.0%), Iroquois (98.2%, a difference of 0.0%), and Okinawan (98.2%, a difference of 0.010%).
| Demographics | Rating | Rank | Nursery School |
| Iranians | 96.3 /100 | #115 | Exceptional 98.2% |
| Spanish | 95.8 /100 | #116 | Exceptional 98.2% |
| Immigrants | France | 95.6 /100 | #117 | Exceptional 98.2% |
| Yugoslavians | 95.4 /100 | #118 | Exceptional 98.2% |
| Thais | 95.0 /100 | #119 | Exceptional 98.2% |
| Okinawans | 94.5 /100 | #120 | Exceptional 98.2% |
| Immigrants | Zimbabwe | 94.2 /100 | #121 | Exceptional 98.2% |
| Immigrants | Japan | 94.0 /100 | #122 | Exceptional 98.2% |
| Syrians | 93.9 /100 | #123 | Exceptional 98.2% |
| Lebanese | 93.8 /100 | #124 | Exceptional 98.2% |
| Iroquois | 93.7 /100 | #125 | Exceptional 98.2% |
| Menominee | 93.6 /100 | #126 | Exceptional 98.2% |
| Immigrants | Saudi Arabia | 93.4 /100 | #127 | Exceptional 98.2% |
| Immigrants | Serbia | 92.4 /100 | #128 | Exceptional 98.2% |
| Cambodians | 91.4 /100 | #129 | Exceptional 98.2% |
Demographics Similar to Serbians by Nursery School
In terms of nursery school, the demographic groups most similar to Serbians are Russian (98.4%, a difference of 0.0%), Immigrants from Austria (98.4%, a difference of 0.0%), Cheyenne (98.4%, a difference of 0.0%), Chickasaw (98.4%, a difference of 0.0%), and Canadian (98.4%, a difference of 0.010%).
| Demographics | Rating | Rank | Nursery School |
| Greeks | 99.7 /100 | #64 | Exceptional 98.4% |
| Maltese | 99.7 /100 | #65 | Exceptional 98.4% |
| Canadians | 99.7 /100 | #66 | Exceptional 98.4% |
| Immigrants | Northern Europe | 99.6 /100 | #67 | Exceptional 98.4% |
| Russians | 99.6 /100 | #68 | Exceptional 98.4% |
| Immigrants | Austria | 99.6 /100 | #69 | Exceptional 98.4% |
| Cheyenne | 99.6 /100 | #70 | Exceptional 98.4% |
| Serbians | 99.6 /100 | #71 | Exceptional 98.4% |
| Chickasaw | 99.6 /100 | #72 | Exceptional 98.4% |
| Cajuns | 99.4 /100 | #73 | Exceptional 98.4% |
| Immigrants | Netherlands | 99.4 /100 | #74 | Exceptional 98.4% |
| Cherokee | 99.3 /100 | #75 | Exceptional 98.3% |
| Immigrants | England | 99.3 /100 | #76 | Exceptional 98.3% |
| Immigrants | Lithuania | 99.3 /100 | #77 | Exceptional 98.3% |
| Delaware | 99.3 /100 | #78 | Exceptional 98.3% |