Immigrants from Jamaica vs Immigrants from Argentina Bachelor's Degree
COMPARE
Immigrants from Jamaica
Immigrants from Argentina
Bachelor's Degree
Bachelor's Degree Comparison
Immigrants from Jamaica
Immigrants from Argentina
32.9%
BACHELOR'S DEGREE
0.5/ 100
METRIC RATING
262nd/ 347
METRIC RANK
42.8%
BACHELOR'S DEGREE
99.6/ 100
METRIC RATING
71st/ 347
METRIC RANK
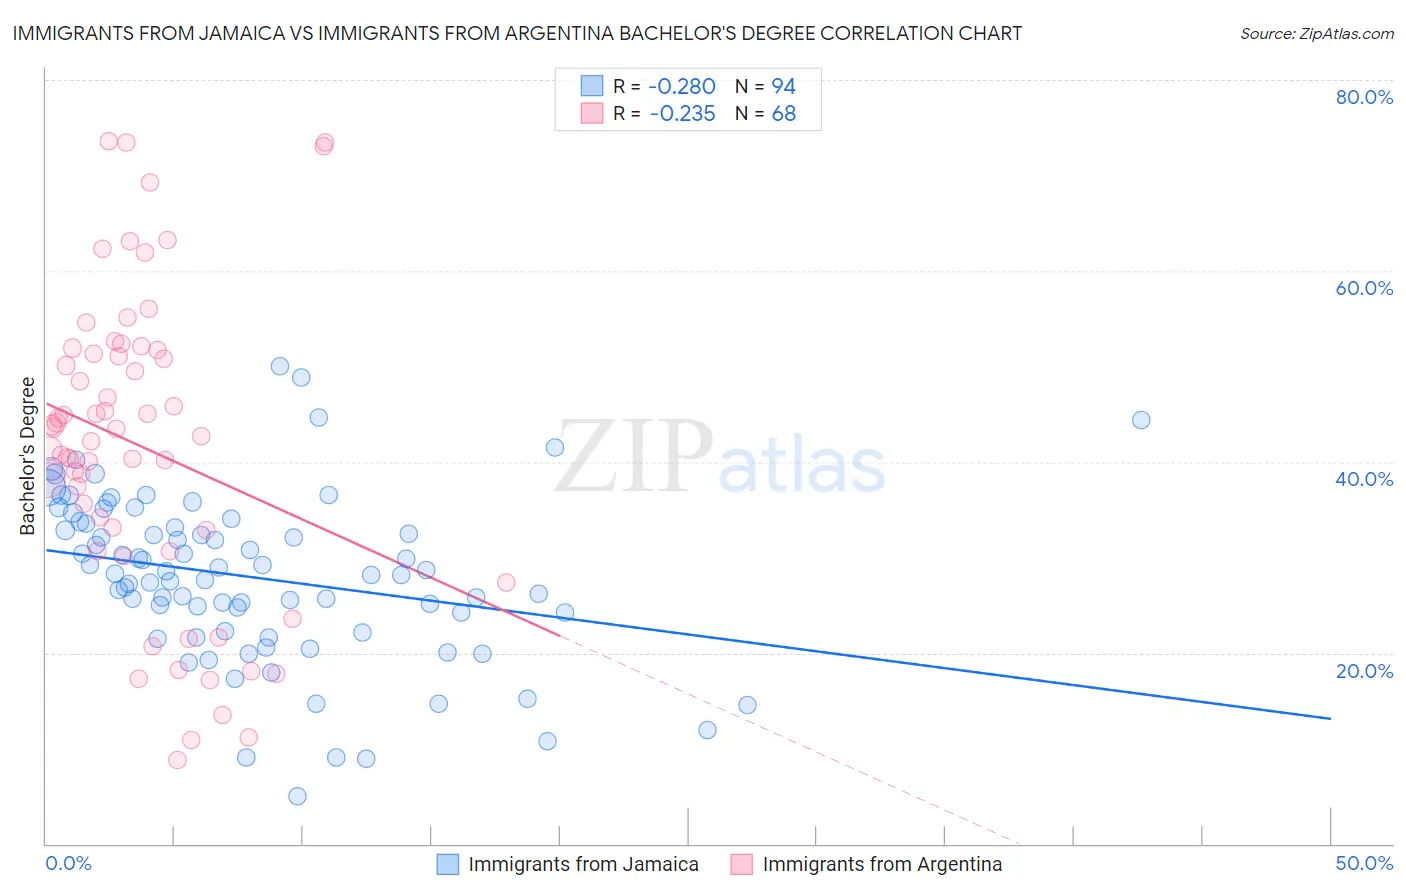
Immigrants from Jamaica vs Immigrants from Argentina Bachelor's Degree Correlation Chart
The statistical analysis conducted on geographies consisting of 301,812,649 people shows a weak negative correlation between the proportion of Immigrants from Jamaica and percentage of population with at least bachelor's degree education in the United States with a correlation coefficient (R) of -0.280 and weighted average of 32.9%. Similarly, the statistical analysis conducted on geographies consisting of 264,417,029 people shows a weak negative correlation between the proportion of Immigrants from Argentina and percentage of population with at least bachelor's degree education in the United States with a correlation coefficient (R) of -0.235 and weighted average of 42.8%, a difference of 30.2%.
Bachelor's Degree Correlation Summary
| Measurement | Immigrants from Jamaica | Immigrants from Argentina |
| Minimum | 4.9% | 8.8% |
| Maximum | 50.0% | 73.6% |
| Range | 45.0% | 64.8% |
| Mean | 27.9% | 41.6% |
| Median | 28.2% | 43.1% |
| Interquartile 25% (IQ1) | 22.3% | 31.8% |
| Interquartile 75% (IQ3) | 33.6% | 51.5% |
| Interquartile Range (IQR) | 11.2% | 19.8% |
| Standard Deviation (Sample) | 8.7% | 16.1% |
| Standard Deviation (Population) | 8.7% | 16.0% |
Similar Demographics by Bachelor's Degree
Demographics Similar to Immigrants from Jamaica by Bachelor's Degree
In terms of bachelor's degree, the demographic groups most similar to Immigrants from Jamaica are African (32.9%, a difference of 0.0%), Malaysian (32.9%, a difference of 0.090%), Belizean (32.8%, a difference of 0.29%), Osage (33.0%, a difference of 0.45%), and French American Indian (33.1%, a difference of 0.50%).
| Demographics | Rating | Rank | Bachelor's Degree |
| Iroquois | 0.7 /100 | #255 | Tragic 33.2% |
| Nicaraguans | 0.6 /100 | #256 | Tragic 33.1% |
| Spanish Americans | 0.6 /100 | #257 | Tragic 33.1% |
| French American Indians | 0.6 /100 | #258 | Tragic 33.1% |
| Osage | 0.5 /100 | #259 | Tragic 33.0% |
| Malaysians | 0.5 /100 | #260 | Tragic 32.9% |
| Africans | 0.5 /100 | #261 | Tragic 32.9% |
| Immigrants | Jamaica | 0.5 /100 | #262 | Tragic 32.9% |
| Belizeans | 0.4 /100 | #263 | Tragic 32.8% |
| Central American Indians | 0.3 /100 | #264 | Tragic 32.5% |
| Bahamians | 0.3 /100 | #265 | Tragic 32.5% |
| Immigrants | Dominica | 0.3 /100 | #266 | Tragic 32.5% |
| Cubans | 0.3 /100 | #267 | Tragic 32.5% |
| Immigrants | Portugal | 0.2 /100 | #268 | Tragic 32.2% |
| Immigrants | Belize | 0.2 /100 | #269 | Tragic 32.1% |
Demographics Similar to Immigrants from Argentina by Bachelor's Degree
In terms of bachelor's degree, the demographic groups most similar to Immigrants from Argentina are Ethiopian (42.8%, a difference of 0.090%), Immigrants from Uzbekistan (42.8%, a difference of 0.14%), Immigrants from Romania (42.9%, a difference of 0.26%), Bhutanese (42.7%, a difference of 0.36%), and Immigrants from Zimbabwe (42.6%, a difference of 0.58%).
| Demographics | Rating | Rank | Bachelor's Degree |
| Argentineans | 99.7 /100 | #64 | Exceptional 43.3% |
| Zimbabweans | 99.7 /100 | #65 | Exceptional 43.3% |
| Immigrants | Netherlands | 99.7 /100 | #66 | Exceptional 43.3% |
| Egyptians | 99.7 /100 | #67 | Exceptional 43.3% |
| Immigrants | Indonesia | 99.7 /100 | #68 | Exceptional 43.3% |
| Immigrants | Pakistan | 99.7 /100 | #69 | Exceptional 43.1% |
| Immigrants | Romania | 99.6 /100 | #70 | Exceptional 42.9% |
| Immigrants | Argentina | 99.6 /100 | #71 | Exceptional 42.8% |
| Ethiopians | 99.5 /100 | #72 | Exceptional 42.8% |
| Immigrants | Uzbekistan | 99.5 /100 | #73 | Exceptional 42.8% |
| Bhutanese | 99.5 /100 | #74 | Exceptional 42.7% |
| Immigrants | Zimbabwe | 99.4 /100 | #75 | Exceptional 42.6% |
| Immigrants | Egypt | 99.4 /100 | #76 | Exceptional 42.6% |
| Immigrants | Eastern Europe | 99.4 /100 | #77 | Exceptional 42.5% |
| Immigrants | Ethiopia | 99.4 /100 | #78 | Exceptional 42.5% |